Estimated Value: $220,000 - $237,000
Studio
1
Bath
1,245
Sq Ft
$183/Sq Ft
Est. Value
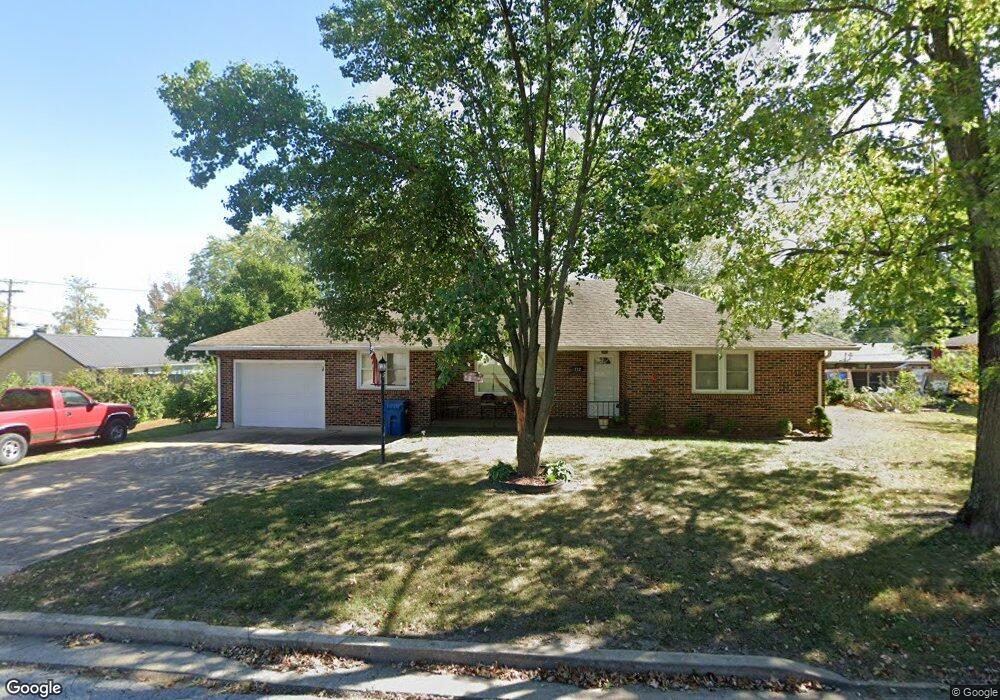
About This Home
This home is located at 512 N Maple St, Eldon, MI 65026 and is currently estimated at $227,303, approximately $182 per square foot. 512 N Maple St is a home located in Miller County with nearby schools including South Elementary School, Eldon Upper Elementary School, and Eldon Middle School.
Ownership History
Date
Name
Owned For
Owner Type
Purchase Details
Closed on
Jun 8, 2017
Sold by
Jungmeyer Glen H and Jungmeyer Jone
Bought by
Farrell Daniel T
Current Estimated Value
Home Financials for this Owner
Home Financials are based on the most recent Mortgage that was taken out on this home.
Original Mortgage
$79,200
Outstanding Balance
$65,774
Interest Rate
4.05%
Mortgage Type
New Conventional
Estimated Equity
$161,529
Purchase Details
Closed on
Dec 23, 2010
Sold by
Jungmeyer Glen H and Jungmeyer Jo Ann
Bought by
Jungmeyer Glen H and Jungmeyer Joan
Purchase Details
Closed on
Dec 21, 2010
Sold by
Federal National Mortgage Association
Bought by
Jungmeyer Glen H and Jungmeyer Jo Ann
Purchase Details
Closed on
Sep 11, 2006
Sold by
Allee James L
Bought by
Parrish Yong H and Parrish Jeffrey C
Home Financials for this Owner
Home Financials are based on the most recent Mortgage that was taken out on this home.
Original Mortgage
$106,900
Interest Rate
6.55%
Mortgage Type
New Conventional
Create a Home Valuation Report for This Property
The Home Valuation Report is an in-depth analysis detailing your home's value as well as a comparison with similar homes in the area
Home Values in the Area
Average Home Value in this Area
Purchase History
| Date | Buyer | Sale Price | Title Company |
|---|---|---|---|
| Farrell Daniel T | -- | None Available | |
| Jungmeyer Glen H | -- | None Available | |
| Jungmeyer Glen H | -- | None Available | |
| Parrish Yong H | -- | None Available |
Source: Public Records
Mortgage History
| Date | Status | Borrower | Loan Amount |
|---|---|---|---|
| Open | Farrell Daniel T | $79,200 | |
| Previous Owner | Parrish Yong H | $106,900 |
Source: Public Records
Tax History
| Year | Tax Paid | Tax Assessment Tax Assessment Total Assessment is a certain percentage of the fair market value that is determined by local assessors to be the total taxable value of land and additions on the property. | Land | Improvement |
|---|---|---|---|---|
| 2025 | $799 | $18,460 | $2,250 | $16,210 |
| 2024 | $732 | $16,120 | $2,040 | $14,080 |
| 2023 | $727 | $16,010 | $2,040 | $13,970 |
| 2022 | $727 | $16,010 | $2,040 | $13,970 |
| 2021 | $728 | $16,010 | $2,040 | $13,970 |
| 2020 | $695 | $15,140 | $2,040 | $13,100 |
| 2019 | $696 | $15,140 | $2,040 | $13,100 |
| 2018 | $697 | $15,140 | $2,040 | $13,100 |
| 2017 | $681 | $15,420 | $2,130 | $13,290 |
| 2016 | $686 | $15,420 | $0 | $0 |
| 2015 | -- | $15,420 | $0 | $0 |
| 2012 | -- | $15,410 | $0 | $0 |
Source: Public Records
Map
Nearby Homes
- 406 N Mill St
- 508 E Harrison St
- 110 W Autry St
- 502 N Vernon Dr
- 207 Franklin Ave
- 204 W Jemphrey Rd
- 612 E High St
- 109 W Haynes St
- 509 Sunset Strip
- Lot 5 W Bourbon St
- Lot 7 W Bourbon St
- Lot 9 W Bourbon St
- Lot 6 W Bourbon St
- Lot 10 W Bourbon St
- 130 S Grand Ave
- 1464 N Oak St
- 107 Lynn Ave
- 306 El Donna Ave
- 225 Missouri 87
- 1007 E Lawson Ave
Your Personal Tour Guide
Ask me questions while you tour the home.