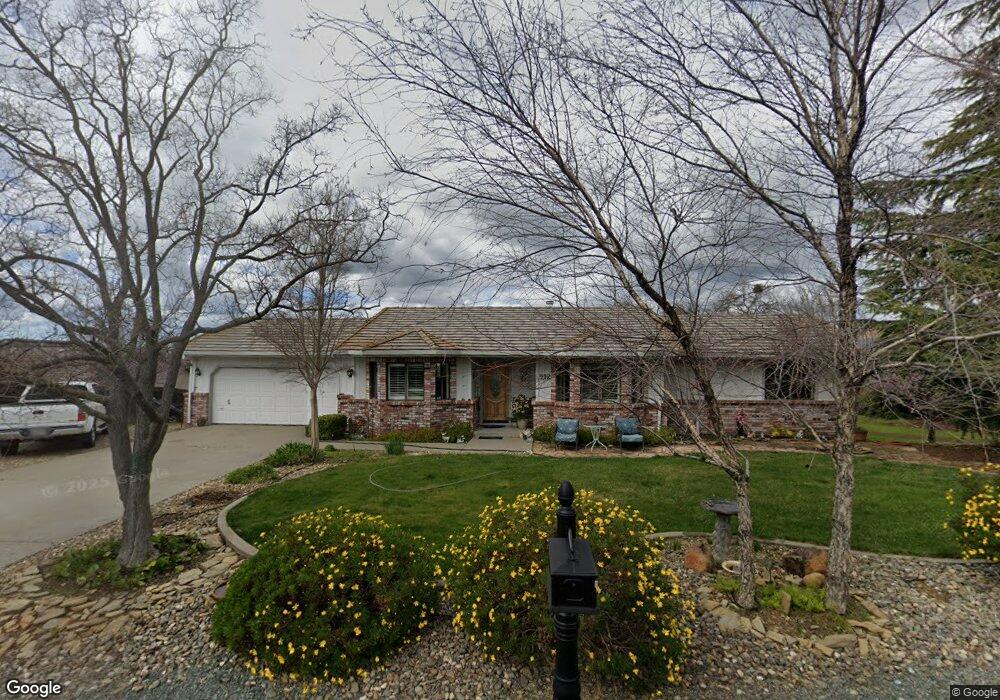
512 Oakridge Rd Valley Springs, CA 95252
Estimated Value: $154,000 - $453,000
4
Beds
2
Baths
1,762
Sq Ft
$212/Sq Ft
Est. Value
About This Home
This home is located at 512 Oakridge Rd, Valley Springs, CA 95252 and is currently estimated at $372,771, approximately $211 per square foot. 512 Oakridge Rd is a home located in Calaveras County with nearby schools including Ione Elementary School, Ione Junior High School, and Argonaut High School.
Ownership History
Date
Name
Owned For
Owner Type
Purchase Details
Closed on
Nov 14, 2023
Sold by
Goode Wendy
Bought by
Wendy Goode 2023 Living Trust and Goode
Current Estimated Value
Purchase Details
Closed on
Jul 31, 2012
Sold by
Bean Joyce and Goode Wendy
Bought by
Goode Wendy
Purchase Details
Closed on
Sep 21, 2011
Sold by
Bean Joyce
Bought by
Bean Joyce and Goode Wendy
Home Financials for this Owner
Home Financials are based on the most recent Mortgage that was taken out on this home.
Original Mortgage
$88,000
Interest Rate
4.43%
Mortgage Type
New Conventional
Purchase Details
Closed on
Aug 19, 2011
Sold by
Gutierrez George F and Gutierrez Karen M
Bought by
Bean Joyce
Home Financials for this Owner
Home Financials are based on the most recent Mortgage that was taken out on this home.
Original Mortgage
$88,000
Interest Rate
4.43%
Mortgage Type
New Conventional
Create a Home Valuation Report for This Property
The Home Valuation Report is an in-depth analysis detailing your home's value as well as a comparison with similar homes in the area
Home Values in the Area
Average Home Value in this Area
Purchase History
| Date | Buyer | Sale Price | Title Company |
|---|---|---|---|
| Wendy Goode 2023 Living Trust | -- | None Listed On Document | |
| Goode Wendy | -- | None Available | |
| Bean Joyce | -- | None Available | |
| Bean Joyce | $148,000 | Calaveras Title Company |
Source: Public Records
Mortgage History
| Date | Status | Borrower | Loan Amount |
|---|---|---|---|
| Previous Owner | Bean Joyce | $88,000 |
Source: Public Records
Tax History Compared to Growth
Tax History
| Year | Tax Paid | Tax Assessment Tax Assessment Total Assessment is a certain percentage of the fair market value that is determined by local assessors to be the total taxable value of land and additions on the property. | Land | Improvement |
|---|---|---|---|---|
| 2025 | $2,199 | $185,882 | $25,114 | $160,768 |
| 2023 | $2,159 | $178,666 | $24,140 | $154,526 |
| 2022 | $2,071 | $175,164 | $23,667 | $151,497 |
| 2021 | $1,911 | $171,730 | $23,203 | $148,527 |
| 2020 | $1,944 | $169,971 | $22,966 | $147,005 |
| 2019 | $2,006 | $166,639 | $22,516 | $144,123 |
| 2018 | $1,921 | $163,373 | $22,075 | $141,298 |
| 2017 | $1,881 | $160,171 | $21,643 | $138,528 |
| 2016 | $1,879 | $157,031 | $21,219 | $135,812 |
| 2015 | $1,844 | $154,673 | $20,901 | $133,772 |
| 2014 | -- | $151,644 | $20,492 | $131,152 |
Source: Public Records
Map
Nearby Homes
- 586 Spyglass Rd
- 870 Carson Dr
- 595 Peachtree Ct
- 24 Pelican Place
- 1052 Mockingbird Ln
- 2778 Silverado Dr
- 1021 Mockingbird Ln
- 10660 Hogan Dam Rd
- 556 Blue Herron Ct
- 1116 Paradise Peak Rd
- 1115 Paradise Peak Rd
- TBD Ranch Rd
- 8270 S Hwy
- 0 Township 3 N Unit 225124501
- 14774 Milton Rd
- 564 Saint Andrews Rd
- 433 S Pebble Beach Ct
- 643 Old Course Ct
- 689 Saint Andrews Rd
- 2661 Stagecoach Dr
- 532 Oakridge Rd
- 484 Oakridge Rd
- 537 Brookline Ct
- 519 Oakridge Rd
- 503 Oakridge Rd
- 503 Oakridge Rd
- 495 Haggin Ct
- 503 Haggin Ct
- 487 Oakridge Rd
- 534 Brookline Ct Unit CT 2/3
- 572 Oakridge Rd
- 538 Brookline Ct
- 471 Oakridge Rd
- 421 Spyglass Rd
- 575 Brookline Ct
- 600 Oakridge Rd
- 561 Oakridge Rd
- 451 Spyglass Rd
- 391 Spyglass Rd
- 496 Haggin Ct