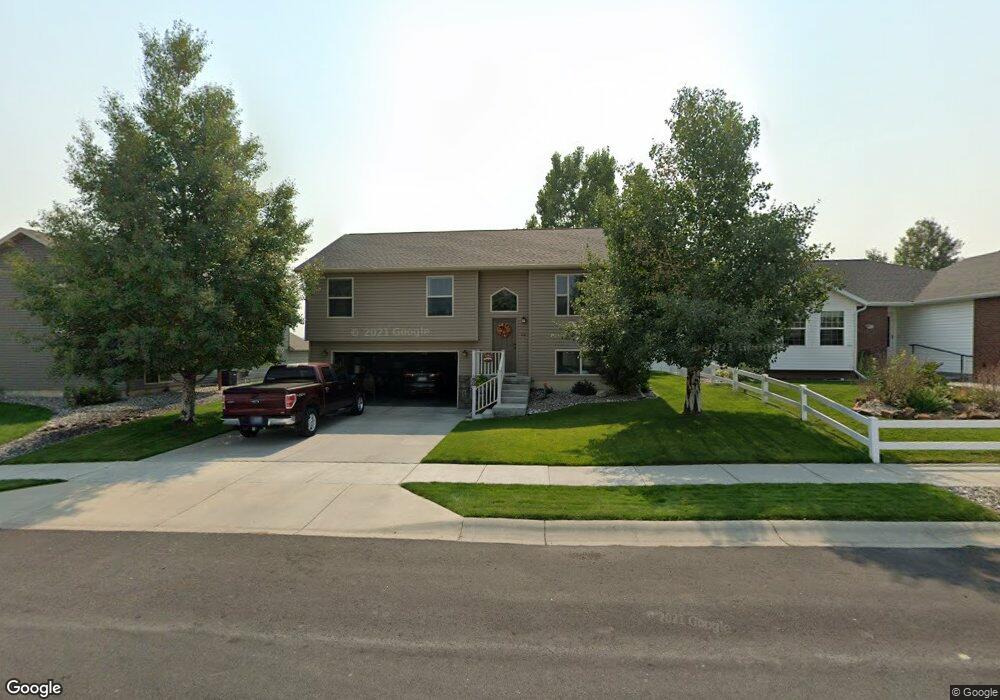
512 Roundhouse Dr Laurel, MT 59044
Estimated Value: $344,000 - $389,000
3
Beds
3
Baths
1,168
Sq Ft
$313/Sq Ft
Est. Value
About This Home
This home is located at 512 Roundhouse Dr, Laurel, MT 59044 and is currently estimated at $365,906, approximately $313 per square foot. 512 Roundhouse Dr is a home located in Yellowstone County with nearby schools including Fred W. Graff School, West School, and Laurel Middle School.
Ownership History
Date
Name
Owned For
Owner Type
Purchase Details
Closed on
Sep 30, 2009
Sold by
Lindenmuth Brandon D
Bought by
Zent David and Zent Judy
Current Estimated Value
Home Financials for this Owner
Home Financials are based on the most recent Mortgage that was taken out on this home.
Original Mortgage
$186,558
Outstanding Balance
$121,819
Interest Rate
5.08%
Mortgage Type
FHA
Estimated Equity
$244,087
Purchase Details
Closed on
Jun 16, 2008
Sold by
Amish Heritage Homes Inc
Bought by
Lindenmuth Brandon D
Home Financials for this Owner
Home Financials are based on the most recent Mortgage that was taken out on this home.
Original Mortgage
$178,659
Interest Rate
6.05%
Mortgage Type
FHA
Purchase Details
Closed on
May 19, 2008
Sold by
Iron Horse Station Llc
Bought by
Amish Heritage Homes Inc
Home Financials for this Owner
Home Financials are based on the most recent Mortgage that was taken out on this home.
Original Mortgage
$178,659
Interest Rate
6.05%
Mortgage Type
FHA
Create a Home Valuation Report for This Property
The Home Valuation Report is an in-depth analysis detailing your home's value as well as a comparison with similar homes in the area
Home Values in the Area
Average Home Value in this Area
Purchase History
| Date | Buyer | Sale Price | Title Company |
|---|---|---|---|
| Zent David | -- | None Available | |
| Lindenmuth Brandon D | -- | St | |
| Amish Heritage Homes Inc | -- | None Available |
Source: Public Records
Mortgage History
| Date | Status | Borrower | Loan Amount |
|---|---|---|---|
| Open | Zent David | $186,558 | |
| Previous Owner | Lindenmuth Brandon D | $178,659 |
Source: Public Records
Tax History
| Year | Tax Paid | Tax Assessment Tax Assessment Total Assessment is a certain percentage of the fair market value that is determined by local assessors to be the total taxable value of land and additions on the property. | Land | Improvement |
|---|---|---|---|---|
| 2025 | $2,946 | $367,400 | $68,276 | $299,124 |
| 2024 | $2,946 | $313,000 | $62,423 | $250,577 |
| 2023 | $2,706 | $313,000 | $62,423 | $250,577 |
| 2022 | $2,176 | $260,700 | $0 | $0 |
| 2021 | $2,389 | $260,700 | $0 | $0 |
| 2020 | $2,217 | $237,000 | $0 | $0 |
| 2019 | $2,170 | $237,000 | $0 | $0 |
| 2018 | $2,156 | $217,700 | $0 | $0 |
| 2017 | $2,002 | $217,700 | $0 | $0 |
| 2016 | $1,977 | $217,500 | $0 | $0 |
| 2015 | $1,953 | $217,500 | $0 | $0 |
| 2014 | $1,706 | $99,110 | $0 | $0 |
Source: Public Records
Map
Nearby Homes
- 406 Roundhouse Dr
- 809 Pennsylvania Ave
- 1031 Fir Ave
- 516 Pennsylvania Ave
- 1108 E 8th St
- 717 E 5th, 506 Alder Ave
- 717 E 5th St
- 414 Wyoming Ave
- 605 Date Ave
- 801 E 4th St
- 1319 Valley Dr
- 110 E 5th St
- 310 1st Ave
- 603 5th Ave
- 320 4th Ave
- 1216 W 12th Street Cir
- 1254 W Beartooth Dr
- 1631 Valley Dr
- 319 6th Ave
- 1109 10th Ave
- 510 Roundhouse Dr
- 1014 Golden Spike Dr
- 511 Santa fe Dr
- 1012 Golden Spike Dr
- 508 Roundhouse Dr
- 509 Santa fe Dr
- 519 Roundhouse Dr
- 517 Roundhouse Dr
- 601 Roundhouse Dr
- 515 Roundhouse Dr
- 507 Santa fe Dr
- 506 Roundhouse Dr
- 513 Roundhouse Dr
- 603 Roundhouse Dr
- 605 Roundhouse Dr
- 509 Roundhouse Dr
- 505 Santa fe Dr
- 511 Roundhouse Dr
- 607 Roundhouse Dr
- 504 Roundhouse Dr
Your Personal Tour Guide
Ask me questions while you tour the home.