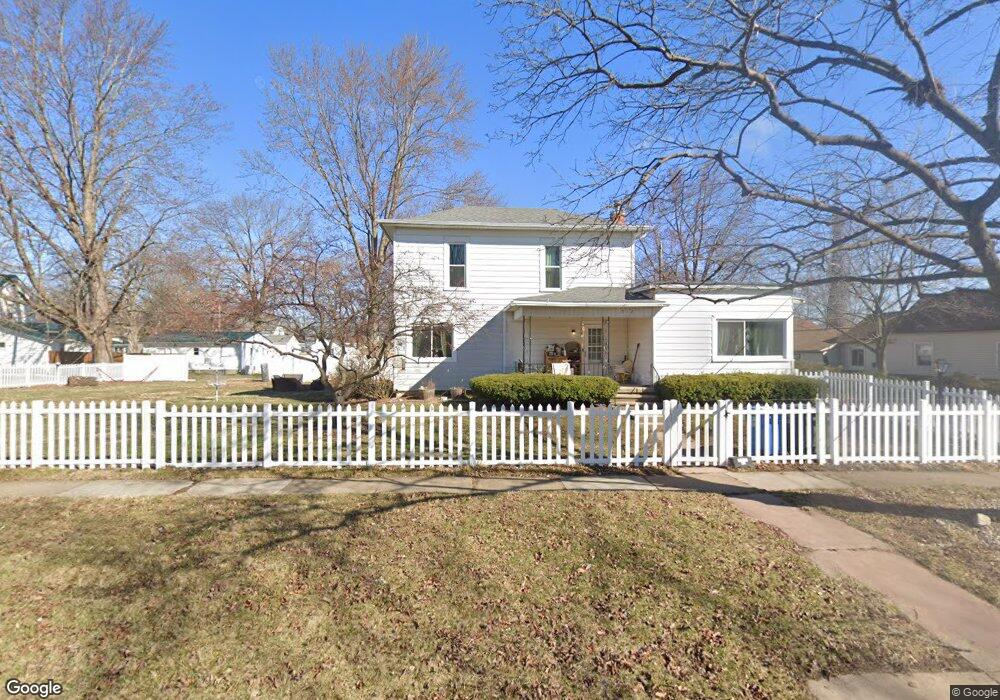
512 Third Steet Findlay, OH 45840
Estimated Value: $190,059 - $199,000
3
Beds
2
Baths
1,710
Sq Ft
$114/Sq Ft
Est. Value
About This Home
This home is located at 512 Third Steet, Findlay, OH 45840 and is currently estimated at $195,015, approximately $114 per square foot. 512 Third Steet is a home located in Hancock County with nearby schools including Jefferson Elementary School, Chamberlin Hill Elementary School, and Donnell Middle School.
Ownership History
Date
Name
Owned For
Owner Type
Purchase Details
Closed on
Nov 12, 2021
Sold by
Sheaffer Daniel E and Sheaffer Evelyne D
Bought by
Daniels Brittany L
Current Estimated Value
Home Financials for this Owner
Home Financials are based on the most recent Mortgage that was taken out on this home.
Original Mortgage
$156,170
Outstanding Balance
$143,103
Interest Rate
2.99%
Mortgage Type
New Conventional
Estimated Equity
$51,912
Purchase Details
Closed on
Apr 19, 2019
Sold by
Mclaughlin Julie J and Patterson Julie J
Bought by
Sheaffer Daniel E and Sheaffer Evelyne D
Home Financials for this Owner
Home Financials are based on the most recent Mortgage that was taken out on this home.
Original Mortgage
$93,467
Interest Rate
4.4%
Mortgage Type
VA
Purchase Details
Closed on
Jun 18, 1982
Bought by
Krouse Sarah M
Create a Home Valuation Report for This Property
The Home Valuation Report is an in-depth analysis detailing your home's value as well as a comparison with similar homes in the area
Home Values in the Area
Average Home Value in this Area
Purchase History
| Date | Buyer | Sale Price | Title Company |
|---|---|---|---|
| Daniels Brittany L | $161,000 | Whitman Title Security | |
| Sheaffer Daniel E | $91,500 | Flag City Title Agency Inc | |
| Krouse Sarah M | -- | -- |
Source: Public Records
Mortgage History
| Date | Status | Borrower | Loan Amount |
|---|---|---|---|
| Open | Daniels Brittany L | $156,170 | |
| Previous Owner | Sheaffer Daniel E | $93,467 |
Source: Public Records
Tax History
| Year | Tax Paid | Tax Assessment Tax Assessment Total Assessment is a certain percentage of the fair market value that is determined by local assessors to be the total taxable value of land and additions on the property. | Land | Improvement |
|---|---|---|---|---|
| 2024 | $1,672 | $47,070 | $8,870 | $38,200 |
| 2023 | $1,675 | $47,070 | $8,870 | $38,200 |
| 2022 | $1,669 | $47,070 | $8,870 | $38,200 |
| 2021 | $1,511 | $37,120 | $8,870 | $28,250 |
| 2020 | $1,511 | $37,120 | $8,870 | $28,250 |
| 2019 | $1,480 | $37,120 | $8,870 | $28,250 |
| 2018 | $1,464 | $32,760 | $8,060 | $24,700 |
| 2017 | $731 | $32,760 | $8,060 | $24,700 |
| 2016 | $1,450 | $32,760 | $8,060 | $24,700 |
| 2015 | $1,100 | $24,450 | $8,060 | $16,390 |
| 2014 | $1,100 | $24,450 | $8,060 | $16,390 |
| 2012 | $1,141 | $25,140 | $8,060 | $17,080 |
Source: Public Records
Map
Nearby Homes
- 206 Greenlawn Ave
- 216 1st St
- 731 5th St
- 123 Glendale Ave
- 829 Maple Ave
- 865 S Main St
- 1304 Douglas Pkwy
- 315 Fairlawn Place
- 400 E Pearl St
- 324 W Mcpherson Ave
- 1100 Stall Dr
- 1113 Hurd Ave
- 423 Elm St
- 412 Lima Ave
- 416 1/2 Lima Ave
- 15591 Canadian Way
- 15586 Canadian Way
- 15615 Canadian Way
- 623 E Sandusky St
- 845 Hurd Ave
Your Personal Tour Guide
Ask me questions while you tour the home.