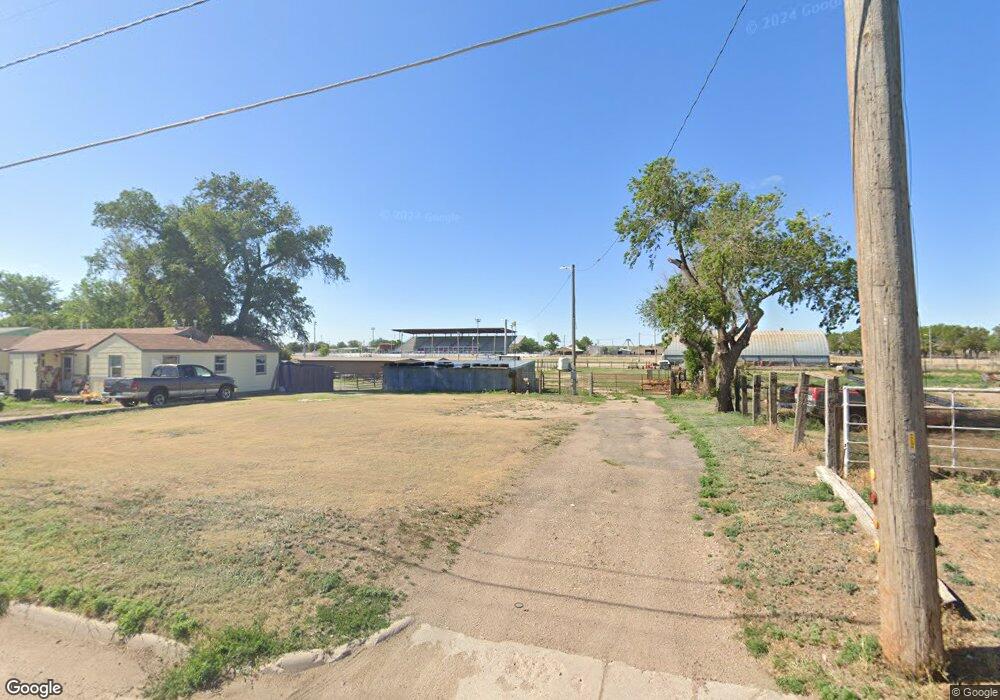
512 W Maple St Garden City, KS 67846
Estimated Value: $68,733 - $493,000
1
Bed
1
Bath
416
Sq Ft
$487/Sq Ft
Est. Value
About This Home
This home is located at 512 W Maple St, Garden City, KS 67846 and is currently estimated at $202,433, approximately $486 per square foot. 512 W Maple St is a home located in Finney County with nearby schools including Horace J. Good Middle School, Bernadine Sitts Intermediate Center, and Garden City Senior High School.
Ownership History
Date
Name
Owned For
Owner Type
Purchase Details
Closed on
Aug 11, 2025
Sold by
Davis Jamie T and Davis Melinda
Bought by
Salas Joel and Aldana Aneli Anahi
Current Estimated Value
Home Financials for this Owner
Home Financials are based on the most recent Mortgage that was taken out on this home.
Original Mortgage
$26,000
Outstanding Balance
$25,978
Interest Rate
6.77%
Mortgage Type
New Conventional
Estimated Equity
$176,455
Purchase Details
Closed on
Apr 13, 2021
Sold by
Davis Loy
Bought by
Davis Loy and Davis Jamie T
Create a Home Valuation Report for This Property
The Home Valuation Report is an in-depth analysis detailing your home's value as well as a comparison with similar homes in the area
Home Values in the Area
Average Home Value in this Area
Purchase History
| Date | Buyer | Sale Price | Title Company |
|---|---|---|---|
| Salas Joel | -- | None Listed On Document | |
| Salas Joel | -- | None Listed On Document | |
| Davis Loy | -- | None Listed On Document |
Source: Public Records
Mortgage History
| Date | Status | Borrower | Loan Amount |
|---|---|---|---|
| Open | Salas Joel | $26,000 | |
| Closed | Salas Joel | $26,000 |
Source: Public Records
Tax History Compared to Growth
Tax History
| Year | Tax Paid | Tax Assessment Tax Assessment Total Assessment is a certain percentage of the fair market value that is determined by local assessors to be the total taxable value of land and additions on the property. | Land | Improvement |
|---|---|---|---|---|
| 2024 | $165 | $1,110 | $1,049 | $61 |
| 2023 | $165 | $1,107 | $1,049 | $58 |
| 2022 | $125 | $865 | $819 | $46 |
| 2021 | $125 | $863 | $819 | $44 |
| 2020 | $124 | $867 | $819 | $48 |
| 2019 | $121 | $870 | $819 | $51 |
| 2018 | $329 | $2,362 | $819 | $1,543 |
| 2017 | $314 | $0 | $0 | $0 |
| 2016 | $289 | $0 | $0 | $0 |
| 2015 | $243 | $0 | $0 | $0 |
| 2012 | -- | $0 | $0 | $0 |
Source: Public Records
Map
Nearby Homes