Estimated Value: $335,000 - $367,000
3
Beds
2
Baths
1,843
Sq Ft
$188/Sq Ft
Est. Value
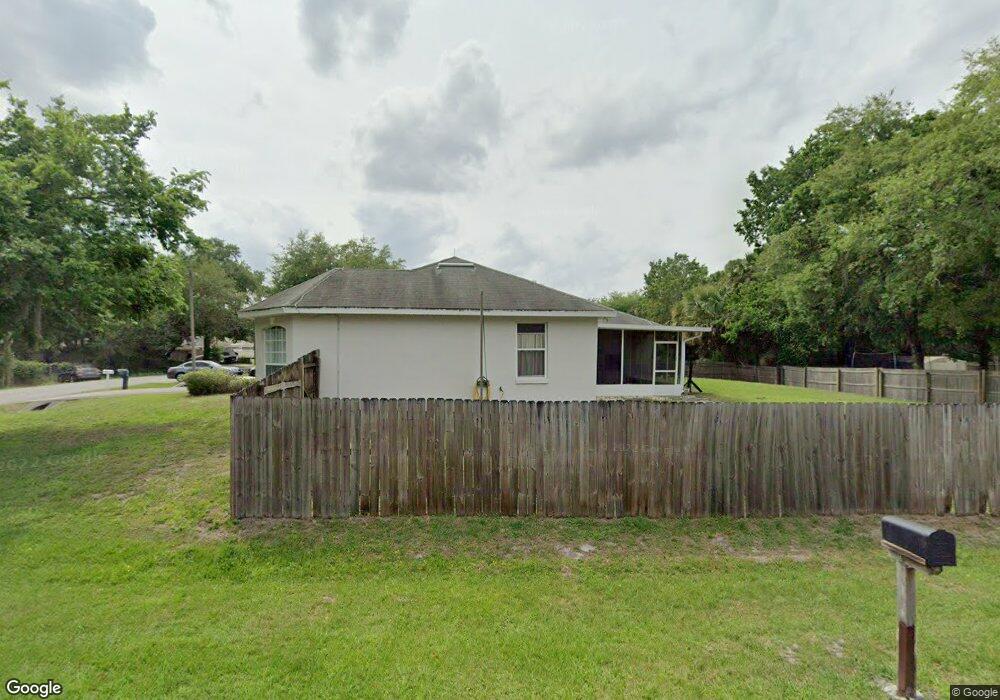
About This Home
This home is located at 5120 Andover St, Cocoa, FL 32927 and is currently estimated at $346,510, approximately $188 per square foot. 5120 Andover St is a home located in Brevard County with nearby schools including Atlantis Elementary School, Space Coast Junior/Senior High School, and Sculptor Charter School.
Ownership History
Date
Name
Owned For
Owner Type
Purchase Details
Closed on
Mar 15, 2007
Sold by
Hopping Robert and Hopping Kimberly
Bought by
Belleman Reese Doane and Gunasekera Clara
Current Estimated Value
Home Financials for this Owner
Home Financials are based on the most recent Mortgage that was taken out on this home.
Original Mortgage
$125,000
Interest Rate
6.22%
Purchase Details
Closed on
Dec 28, 2004
Sold by
Renar Development Co
Bought by
Hopping Robert and Hopping Kimberly
Home Financials for this Owner
Home Financials are based on the most recent Mortgage that was taken out on this home.
Original Mortgage
$139,875
Interest Rate
5.66%
Purchase Details
Closed on
Mar 15, 2004
Sold by
Lleva E V
Bought by
Renar Development Co
Purchase Details
Closed on
Aug 29, 2003
Sold by
Collins Collins Lela F Lela F and Collins Dresler Annette
Bought by
Lleva E V
Create a Home Valuation Report for This Property
The Home Valuation Report is an in-depth analysis detailing your home's value as well as a comparison with similar homes in the area
Home Values in the Area
Average Home Value in this Area
Purchase History
We collect this data history from publicly available records. To have your information removed, we recommend requesting removal directly through your county’s website.
| Date | Buyer | Sale Price | Title Company |
|---|---|---|---|
| Belleman Reese Doane | $225,000 | Fidelity Natl Title Ins Co | |
| Hopping Robert | $162,200 | Precise Title Inc | |
| Renar Development Co | $27,900 | Precise Title Inc | |
| Lleva E V | $45,000 | The Title Station Inc |
Source: Public Records
Mortgage History
We collect this data history from publicly available records. To have your information removed, we recommend requesting removal directly through your county’s website.
| Date | Status | Borrower | Loan Amount |
|---|---|---|---|
| Closed | Belleman Reese Doane | $125,000 | |
| Previous Owner | Hopping Robert | $139,875 |
Source: Public Records
Tax History
| Year | Tax Paid | Tax Assessment Tax Assessment Total Assessment is a certain percentage of the fair market value that is determined by local assessors to be the total taxable value of land and additions on the property. | Land | Improvement |
|---|---|---|---|---|
| 2025 | $1,612 | $113,520 | -- | -- |
| 2024 | $1,575 | $110,330 | -- | -- |
| 2023 | $1,575 | $107,310 | $0 | $0 |
| 2022 | $1,471 | $104,190 | $0 | $0 |
| 2021 | $1,471 | $101,160 | $0 | $0 |
| 2020 | $1,395 | $99,770 | $0 | $0 |
| 2019 | $1,330 | $97,530 | $0 | $0 |
| 2018 | $1,323 | $95,720 | $0 | $0 |
| 2017 | $1,314 | $93,760 | $0 | $0 |
| 2016 | $1,317 | $91,840 | $18,000 | $73,840 |
| 2015 | $1,333 | $91,210 | $15,000 | $76,210 |
| 2014 | $1,335 | $90,490 | $11,000 | $79,490 |
Source: Public Records
Map
Nearby Homes
- 5170 Andover St
- 5145 Everett St
- 5165 Patricia St
- 5155 Mayflower St
- 5075 Carter St
- 5145 Carter St
- 0 Cinnamon Fern Blvd
- 4821 Falcon Blvd
- 7455 Darien Rd
- 7456 Camio Ave
- 4824 Curtis Blvd
- 5070 Curtis Blvd
- 6813 Cecil Rd
- 4765 Curtis Blvd
- 5303 Yaupon Holly Dr
- 5350 Cinnamon Fern Blvd
- 6990 Camden Ave
- 6815 Bryant Rd
- 4770 Ivan St
- 4845 Hawley Rd
- 7205 Durban Ave
- 7215 Durban Ave
- 7195 Durban Ave
- 7210 Export Ave
- 7225 Durban Ave
- 7185 Durban Ave
- 7200 Durban Ave
- 7220 Export Ave
- 5200 Frisco St
- 7170 Export Ave
- 5130 Frisco St
- 7175 Durban Ave
- 7230 Export Ave
- 5130 Andover St
- 7205 Export Ave
- 7195 Export Ave
- 7215 Export Ave
- 7235 Durban Ave
- 7185 Export Ave
- 7165 Durban Ave
Your Personal Tour Guide
Ask me questions while you tour the home.