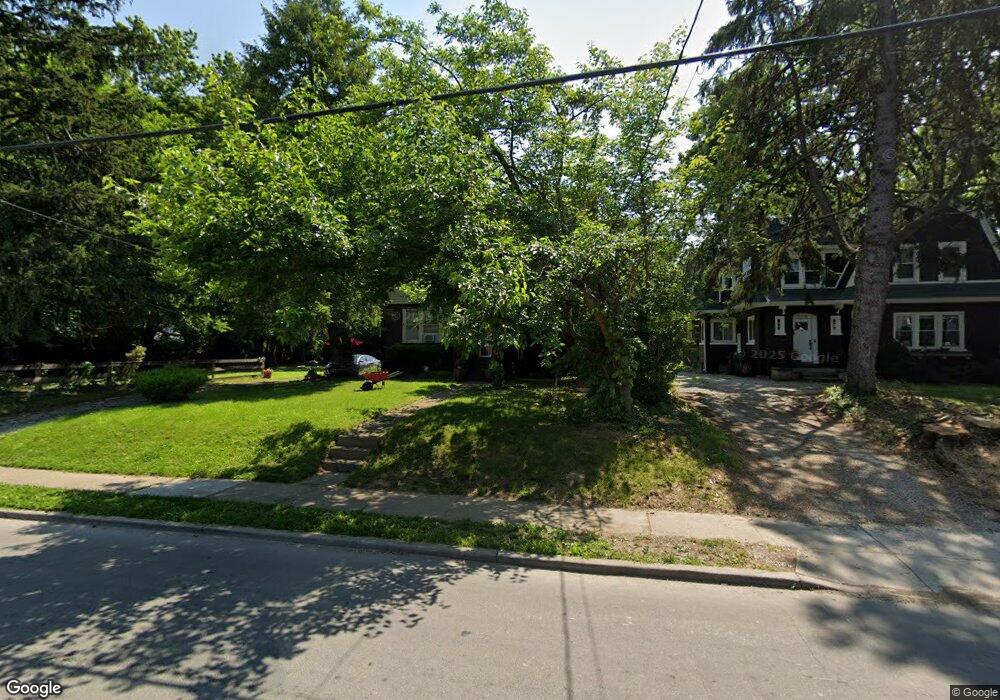
5120 Stewart Ave Cincinnati, OH 45227
Madisonville NeighborhoodEstimated Value: $390,452 - $478,000
4
Beds
2
Baths
2,300
Sq Ft
$185/Sq Ft
Est. Value
About This Home
This home is located at 5120 Stewart Ave, Cincinnati, OH 45227 and is currently estimated at $426,363, approximately $185 per square foot. 5120 Stewart Ave is a home located in Hamilton County with nearby schools including John P. Parker School, Shroder High School, and Clark Montessori High School.
Ownership History
Date
Name
Owned For
Owner Type
Purchase Details
Closed on
Nov 9, 2021
Sold by
Browing Curlie M
Bought by
Browning Curlie M
Current Estimated Value
Home Financials for this Owner
Home Financials are based on the most recent Mortgage that was taken out on this home.
Original Mortgage
$135,972
Interest Rate
3.05%
Mortgage Type
FHA
Purchase Details
Closed on
Sep 24, 2015
Sold by
Browing Curlie and Browening Curlie M
Bought by
Browening Curlie M
Home Financials for this Owner
Home Financials are based on the most recent Mortgage that was taken out on this home.
Original Mortgage
$144,217
Interest Rate
3.84%
Mortgage Type
FHA
Purchase Details
Closed on
Jul 3, 2008
Sold by
Browning Willie N and Browning Bertha
Bought by
Browning Curlie
Home Financials for this Owner
Home Financials are based on the most recent Mortgage that was taken out on this home.
Original Mortgage
$127,032
Interest Rate
6.1%
Mortgage Type
Unknown
Create a Home Valuation Report for This Property
The Home Valuation Report is an in-depth analysis detailing your home's value as well as a comparison with similar homes in the area
Home Values in the Area
Average Home Value in this Area
Purchase History
| Date | Buyer | Sale Price | Title Company |
|---|---|---|---|
| Browning Curlie M | -- | Rosenberg Jay A | |
| Browning Curlie M | -- | None Listed On Document | |
| Browening Curlie M | -- | Terratitle Llc | |
| Browning Curlie | -- | Attorney |
Source: Public Records
Mortgage History
| Date | Status | Borrower | Loan Amount |
|---|---|---|---|
| Previous Owner | Browning Curlie M | $135,972 | |
| Previous Owner | Browening Curlie M | $144,217 | |
| Previous Owner | Browning Curlie | $127,032 |
Source: Public Records
Tax History Compared to Growth
Tax History
| Year | Tax Paid | Tax Assessment Tax Assessment Total Assessment is a certain percentage of the fair market value that is determined by local assessors to be the total taxable value of land and additions on the property. | Land | Improvement |
|---|---|---|---|---|
| 2024 | $5,063 | $94,745 | $16,254 | $78,491 |
| 2023 | $5,226 | $94,745 | $16,254 | $78,491 |
| 2022 | $3,401 | $58,671 | $8,008 | $50,663 |
| 2021 | $3,260 | $58,671 | $8,008 | $50,663 |
| 2020 | $3,370 | $58,671 | $8,008 | $50,663 |
| 2019 | $3,835 | $51,923 | $7,088 | $44,835 |
| 2018 | $3,841 | $51,923 | $7,088 | $44,835 |
| 2017 | $3,649 | $51,923 | $7,088 | $44,835 |
| 2016 | $3,500 | $49,070 | $6,776 | $42,294 |
| 2015 | $3,155 | $49,070 | $6,776 | $42,294 |
| 2014 | $3,178 | $49,070 | $6,776 | $42,294 |
| 2013 | $3,521 | $47,642 | $6,580 | $41,062 |
Source: Public Records
Map
Nearby Homes
- 5123 Stewart Ave
- 5103 Ebersole Ave
- 5007 Anderson Place
- 5005 Anderson Place
- 5003 Anderson Place
- 5521 Chandler St
- 5001 Anderson Place
- 5619 Chandler St
- 5610 Chandler St
- 5720 Madison Rd
- 5312 Dora St
- 5200 Whetsel Ave
- 5317 Whetsel Ave
- 5330 Whetsel Ave
- 5454 Owasco St
- 6102 Conover St
- 5439 Whetsel Ave
- 5424 Ward St
- 6116 Conover St
- 5114 Stewart Ave
- 5111 Ebersole Ave
- 5113 Ebersole Ave
- 5110 Stewart Ave
- 5109 Ebersole Ave
- 5206 Stewart Ave
- 5115 Ebersole Ave
- 5107 Ebersole Ave
- 5119 Stewart Ave
- 5028 Stewart Ave
- 5115 Stewart Ave
- 5208 Stewart Ave
- 5201 Ebersole Ave
- 5125 Stewart Ave
- 5112 Ebersole Ave
- 5114 Ebersole Ave
- 5109 Stewart Ave
- 5021 Ebersole Ave
- 5110 Ebersole Ave
- 5205 Stewart Ave