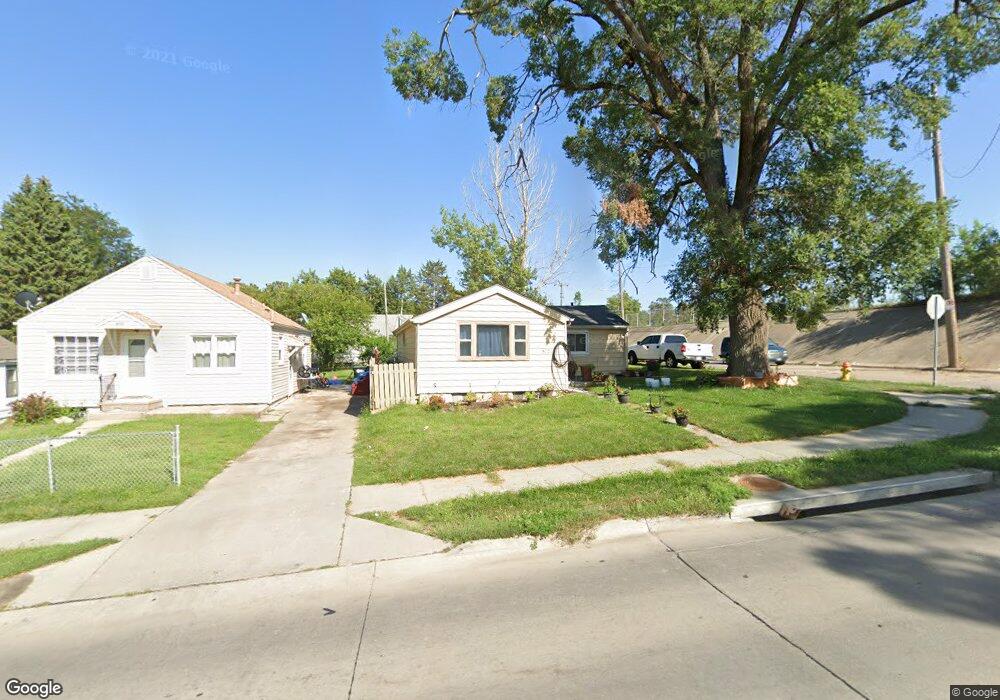
5121 S 48th St Omaha, NE 68117
South Central Omaha NeighborhoodEstimated Value: $191,000 - $236,000
3
Beds
2
Baths
1,958
Sq Ft
$111/Sq Ft
Est. Value
About This Home
This home is located at 5121 S 48th St, Omaha, NE 68117 and is currently estimated at $218,085, approximately $111 per square foot. 5121 S 48th St is a home located in Douglas County with nearby schools including Ashland Park-Robbins Elementary School, Sts. Peter and Paul School, and St Thomas More School.
Ownership History
Date
Name
Owned For
Owner Type
Purchase Details
Closed on
Oct 30, 2023
Sold by
Lxc Group Llc
Bought by
Bamk Properties Llc
Current Estimated Value
Home Financials for this Owner
Home Financials are based on the most recent Mortgage that was taken out on this home.
Original Mortgage
$138,000
Outstanding Balance
$93,267
Interest Rate
7.49%
Mortgage Type
Credit Line Revolving
Estimated Equity
$124,818
Purchase Details
Closed on
Oct 25, 2023
Sold by
Lara Jose M and Lara Erika R
Bought by
Lxc Group Llc
Home Financials for this Owner
Home Financials are based on the most recent Mortgage that was taken out on this home.
Original Mortgage
$138,000
Outstanding Balance
$93,267
Interest Rate
7.49%
Mortgage Type
Credit Line Revolving
Estimated Equity
$124,818
Purchase Details
Closed on
Jun 14, 2012
Sold by
Lara Jose M and Rivera Erika
Bought by
City Of Omaha
Purchase Details
Closed on
Aug 18, 2006
Sold by
Ward Martin L
Bought by
Lara Jose M
Create a Home Valuation Report for This Property
The Home Valuation Report is an in-depth analysis detailing your home's value as well as a comparison with similar homes in the area
Home Values in the Area
Average Home Value in this Area
Purchase History
| Date | Buyer | Sale Price | Title Company |
|---|---|---|---|
| Bamk Properties Llc | $169,000 | Platinum Title | |
| Lxc Group Llc | $152,000 | Platinum Title | |
| City Of Omaha | $162 | None Available | |
| Lara Jose M | $102,000 | -- |
Source: Public Records
Mortgage History
| Date | Status | Borrower | Loan Amount |
|---|---|---|---|
| Open | Bamk Properties Llc | $138,000 |
Source: Public Records
Tax History Compared to Growth
Tax History
| Year | Tax Paid | Tax Assessment Tax Assessment Total Assessment is a certain percentage of the fair market value that is determined by local assessors to be the total taxable value of land and additions on the property. | Land | Improvement |
|---|---|---|---|---|
| 2024 | $3,941 | $186,800 | $11,000 | $175,800 |
| 2023 | $3,941 | $186,800 | $11,000 | $175,800 |
| 2022 | $3,428 | $160,600 | $8,900 | $151,700 |
| 2021 | $3,042 | $143,700 | $8,900 | $134,800 |
| 2020 | $2,777 | $129,700 | $8,900 | $120,800 |
| 2019 | $2,785 | $129,700 | $8,900 | $120,800 |
| 2018 | $2,475 | $115,100 | $8,900 | $106,200 |
| 2017 | $2,029 | $93,900 | $6,000 | $87,900 |
| 2016 | $2,015 | $93,900 | $6,000 | $87,900 |
| 2015 | $1,988 | $93,900 | $6,000 | $87,900 |
| 2014 | $1,988 | $93,900 | $6,000 | $87,900 |
Source: Public Records
Map
Nearby Homes