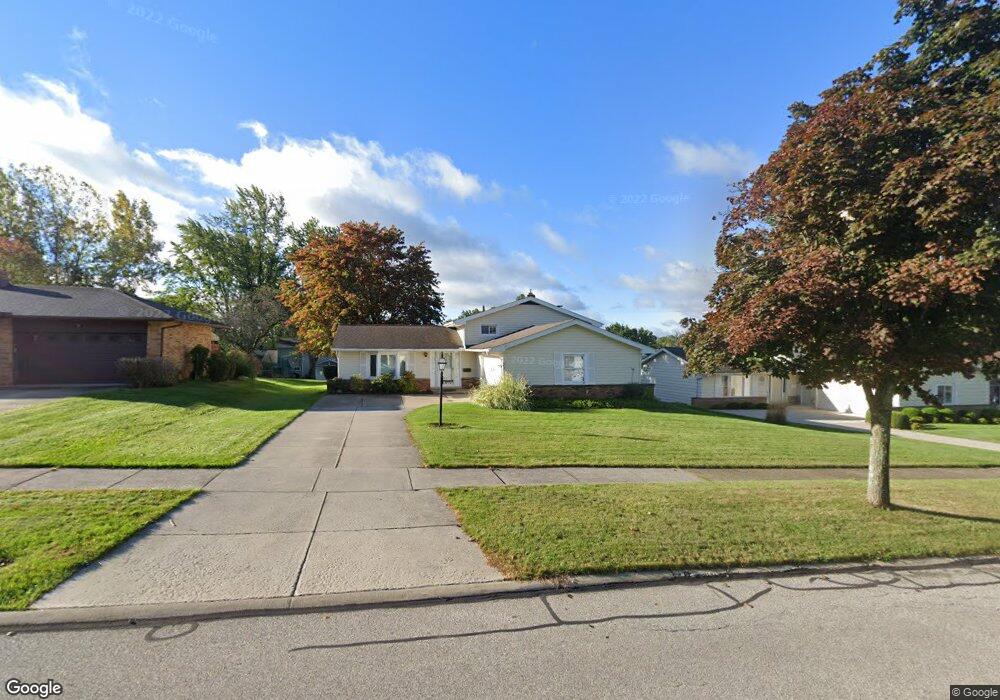
5121 Sandy Hook Dr Cleveland, OH 44134
Estimated Value: $292,851 - $317,000
3
Beds
2
Baths
1,948
Sq Ft
$157/Sq Ft
Est. Value
About This Home
This home is located at 5121 Sandy Hook Dr, Cleveland, OH 44134 and is currently estimated at $306,213, approximately $157 per square foot. 5121 Sandy Hook Dr is a home located in Cuyahoga County with nearby schools including Green Valley Elementary School, Normandy High School, and Hillside Middle School.
Ownership History
Date
Name
Owned For
Owner Type
Purchase Details
Closed on
Feb 16, 2004
Sold by
Toth Dennis John and Toth Helen Mary
Bought by
Molnar Mickey Z
Current Estimated Value
Home Financials for this Owner
Home Financials are based on the most recent Mortgage that was taken out on this home.
Original Mortgage
$148,750
Outstanding Balance
$70,392
Interest Rate
5.96%
Mortgage Type
Purchase Money Mortgage
Estimated Equity
$235,821
Purchase Details
Closed on
May 17, 1994
Bought by
Toth Dennis John
Purchase Details
Closed on
Aug 6, 1990
Sold by
Urban Christina
Bought by
Urban Christina , Trustee
Purchase Details
Closed on
Mar 27, 1990
Bought by
Urban Christina
Purchase Details
Closed on
Apr 8, 1977
Sold by
Froula Richard and Froula Charla
Bought by
Urban John Hjr
Purchase Details
Closed on
Jan 1, 1975
Bought by
Froula Richard and Froula Charla
Create a Home Valuation Report for This Property
The Home Valuation Report is an in-depth analysis detailing your home's value as well as a comparison with similar homes in the area
Home Values in the Area
Average Home Value in this Area
Purchase History
| Date | Buyer | Sale Price | Title Company |
|---|---|---|---|
| Molnar Mickey Z | $175,000 | Title Co | |
| Toth Dennis John | $128,000 | -- | |
| Urban Christina , Trustee | -- | -- | |
| Urban Christina | -- | -- | |
| Urban John Hjr | $56,800 | -- | |
| Froula Richard | -- | -- |
Source: Public Records
Mortgage History
| Date | Status | Borrower | Loan Amount |
|---|---|---|---|
| Open | Molnar Mickey Z | $148,750 |
Source: Public Records
Tax History Compared to Growth
Tax History
| Year | Tax Paid | Tax Assessment Tax Assessment Total Assessment is a certain percentage of the fair market value that is determined by local assessors to be the total taxable value of land and additions on the property. | Land | Improvement |
|---|---|---|---|---|
| 2024 | $5,080 | $84,210 | $16,765 | $67,445 |
| 2023 | $4,573 | $65,380 | $13,020 | $52,360 |
| 2022 | $4,531 | $65,380 | $13,020 | $52,360 |
| 2021 | $4,666 | $65,380 | $13,020 | $52,360 |
| 2020 | $4,140 | $51,100 | $10,190 | $40,920 |
| 2019 | $3,983 | $146,000 | $29,100 | $116,900 |
| 2018 | $4,007 | $51,100 | $10,190 | $40,920 |
| 2017 | $3,831 | $45,570 | $8,470 | $37,100 |
| 2016 | $3,808 | $45,570 | $8,470 | $37,100 |
| 2015 | $3,753 | $45,570 | $8,470 | $37,100 |
| 2014 | $3,753 | $46,980 | $8,720 | $38,260 |
Source: Public Records
Map
Nearby Homes
- 7531 Vista Dr
- 4402 Stary Dr
- 4803 Sassafras Dr
- 4440 Coral Gables Dr
- 4591 W Sprague Rd
- 8053 Thornhurst Dr
- 7558 Pleasant View Dr
- Rosecliff Plan at South Pointe - Townhomes
- Caroline w/ Covered Rear Porch Plan at South Pointe - Townhomes
- 7351 S Pointe Ln
- 7580 S Pointe Ln
- 6417 Thoreau Dr
- 7987 Ridge Rd
- 7730 Lime Ln
- 5810 Ely Vista Dr
- 2830 Brian Dr
- 8300 Ridgedale Rd
- 2800 Bonny Blvd
- 3610 Jeanne Dr
- 8175 Tanglewood Ln
- 5101 Sandy Hook Dr
- 5141 Sandy Hook Dr
- 5201 Sandy Hook Dr
- 5041 Sandy Hook Dr
- 5200 Woodbury Hills Dr
- 5140 Woodbury Hills Dr
- 5220 Woodbury Hills Dr
- 5120 Sandy Hook Dr
- 5100 Woodbury Hills Dr
- 5100 Sandy Hook Dr
- 5140 Sandy Hook Dr
- 5221 Sandy Hook Dr
- 5021 Sandy Hook Dr
- 5240 Woodbury Hills Dr
- 5040 Sandy Hook Dr
- 5020 Woodbury Hills Dr
- 5020 Sandy Hook Dr
- 5300 Woodbury Hills Dr
- 5301 Sandy Hook Dr
- 5001 Sandy Hook Dr