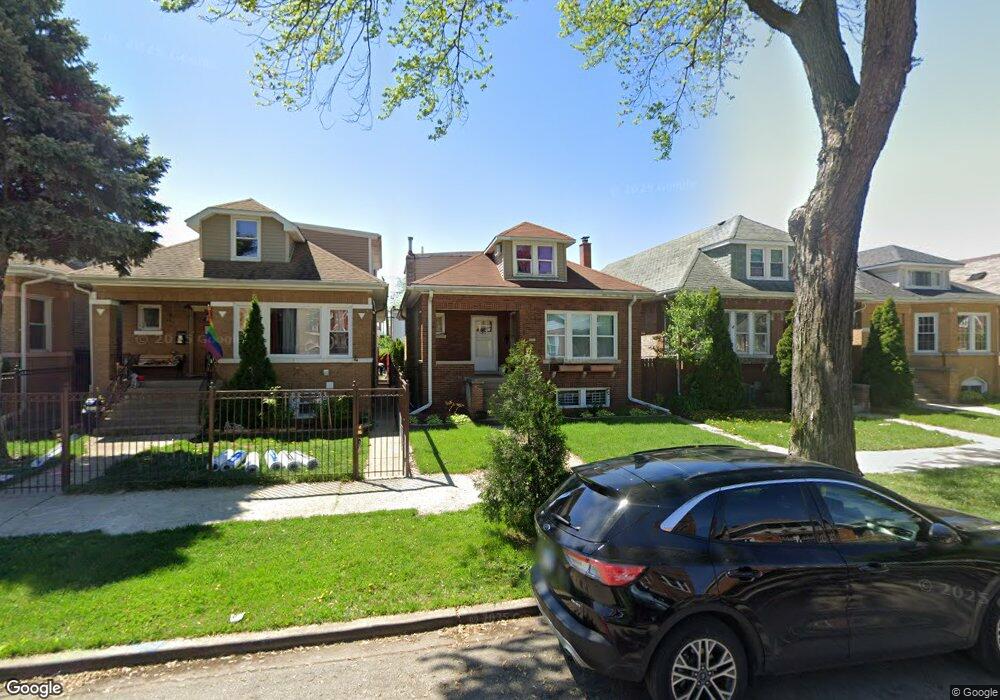
5121 W Wellington Ave Chicago, IL 60641
Cragin NeighborhoodEstimated Value: $353,000 - $377,000
2
Beds
1
Bath
1,092
Sq Ft
$334/Sq Ft
Est. Value
About This Home
This home is located at 5121 W Wellington Ave, Chicago, IL 60641 and is currently estimated at $364,658, approximately $333 per square foot. 5121 W Wellington Ave is a home located in Cook County with nearby schools including Falconer Elementary School, Foreman College and Career Academy, and Kelvyn Park High School.
Ownership History
Date
Name
Owned For
Owner Type
Purchase Details
Closed on
Sep 15, 2014
Sold by
Mendoza Sergio
Bought by
Mendoza Sergio and Mendoza Carlos
Current Estimated Value
Purchase Details
Closed on
Mar 11, 2014
Sold by
Mendoza Sergio
Bought by
Mendoza Carlos
Purchase Details
Closed on
Mar 18, 2004
Sold by
Mendoza Carlos
Bought by
Mendoza Sergio
Purchase Details
Closed on
Mar 13, 2003
Sold by
Matker Mark D
Bought by
Mendoza Carlos
Home Financials for this Owner
Home Financials are based on the most recent Mortgage that was taken out on this home.
Original Mortgage
$199,500
Outstanding Balance
$86,140
Interest Rate
5.94%
Estimated Equity
$278,518
Purchase Details
Closed on
Aug 23, 1994
Sold by
Berg Arthur W and Kubit Joseph S
Bought by
Matker Mark D
Home Financials for this Owner
Home Financials are based on the most recent Mortgage that was taken out on this home.
Original Mortgage
$90,000
Interest Rate
8.72%
Create a Home Valuation Report for This Property
The Home Valuation Report is an in-depth analysis detailing your home's value as well as a comparison with similar homes in the area
Home Values in the Area
Average Home Value in this Area
Purchase History
| Date | Buyer | Sale Price | Title Company |
|---|---|---|---|
| Mendoza Sergio | -- | None Available | |
| Mendoza Carlos | -- | Fidelity Natl Title Ins Co | |
| Mendoza Sergio | -- | -- | |
| Mendoza Carlos | $210,000 | Cti | |
| Matker Mark D | $102,000 | -- |
Source: Public Records
Mortgage History
| Date | Status | Borrower | Loan Amount |
|---|---|---|---|
| Open | Mendoza Carlos | $199,500 | |
| Previous Owner | Matker Mark D | $90,000 |
Source: Public Records
Tax History Compared to Growth
Tax History
| Year | Tax Paid | Tax Assessment Tax Assessment Total Assessment is a certain percentage of the fair market value that is determined by local assessors to be the total taxable value of land and additions on the property. | Land | Improvement |
|---|---|---|---|---|
| 2024 | $3,945 | $29,001 | $6,938 | $22,063 |
| 2023 | $3,824 | $22,000 | $5,625 | $16,375 |
| 2022 | $3,824 | $22,000 | $5,625 | $16,375 |
| 2021 | $3,757 | $22,003 | $5,628 | $16,375 |
| 2020 | $4,208 | $21,982 | $4,687 | $17,295 |
| 2019 | $4,276 | $24,699 | $4,687 | $20,012 |
| 2018 | $4,203 | $24,699 | $4,687 | $20,012 |
| 2017 | $3,778 | $20,915 | $4,125 | $16,790 |
| 2016 | $3,691 | $20,915 | $4,125 | $16,790 |
| 2015 | $3,354 | $20,915 | $4,125 | $16,790 |
| 2014 | $3,094 | $19,230 | $3,750 | $15,480 |
| 2013 | $3,021 | $19,230 | $3,750 | $15,480 |
Source: Public Records
Map
Nearby Homes
- 3043 N Laramie Ave Unit 2
- 3045 N Laramie Ave Unit 2
- 5042 W Wellington Ave
- 5038 W Nelson St
- 5243 W Oakdale Ave
- 5021 W Nelson St
- 5244 W Barry Ave
- 5041 W Fletcher St
- 5254 W Wolfram St
- 5303 W George St
- 5121 W Diversey Ave Unit 3N
- 5121 W Diversey Ave Unit 3S
- 4918-22 W Diversey Ave
- 5335 W Barry Ave
- 4950 W Diversey Ave
- 5233 W Parker Ave
- 3036 N Long Ave
- 2939 N Lotus Ave
- 4825 W George St
- 5205 W Drummond Place Unit 1
- 5125 W Wellington Ave
- 5119 W Wellington Ave
- 5129 W Wellington Ave
- 5117 W Wellington Ave
- 5131 W Wellington Ave
- 5113 W Wellington Ave
- 5135 W Wellington Ave Unit 2
- 5111 W Wellington Ave
- 5124 W Oakdale Ave
- 5118 W Oakdale Ave
- 5137 W Wellington Ave
- 5107 W Wellington Ave
- 5128 W Oakdale Ave
- 5114 W Oakdale Ave
- 5122 W Oakdale Ave
- 5130 W Oakdale Ave
- 5112 W Oakdale Ave
- 5105 W Wellington Ave
- 5141 W Wellington Ave
- 5134 W Oakdale Ave