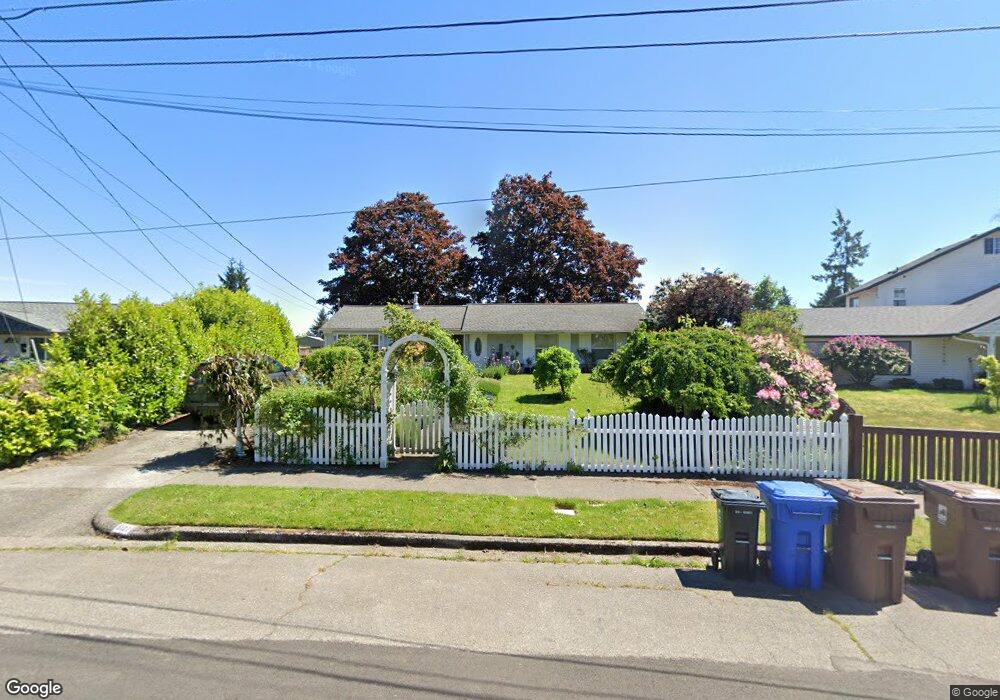
5122 N Mance St Tacoma, WA 98407
North Tacoma NeighborhoodEstimated Value: $486,794 - $514,000
3
Beds
1
Bath
1,134
Sq Ft
$441/Sq Ft
Est. Value
About This Home
This home is located at 5122 N Mance St, Tacoma, WA 98407 and is currently estimated at $499,949, approximately $440 per square foot. 5122 N Mance St is a home located in Pierce County with nearby schools including Downing Elementary School, Truman Middle School, and Dr. Dolores Silas High School.
Ownership History
Date
Name
Owned For
Owner Type
Purchase Details
Closed on
Jun 19, 2000
Sold by
Brooks James
Bought by
Rayburn Virginia M
Current Estimated Value
Home Financials for this Owner
Home Financials are based on the most recent Mortgage that was taken out on this home.
Original Mortgage
$73,000
Outstanding Balance
$26,303
Interest Rate
8.53%
Estimated Equity
$473,646
Purchase Details
Closed on
Sep 24, 1998
Sold by
Neel Daniel A
Bought by
Brooks James and Vasquez Brooks Priscilla
Home Financials for this Owner
Home Financials are based on the most recent Mortgage that was taken out on this home.
Original Mortgage
$96,626
Interest Rate
6.88%
Mortgage Type
FHA
Purchase Details
Closed on
Apr 27, 1998
Sold by
Obrien Timothy W
Bought by
Obrien Mary Lou Hanson
Purchase Details
Closed on
Feb 10, 1998
Sold by
Hanson Ingwer L
Bought by
Hanson Obrien Mary Lou
Create a Home Valuation Report for This Property
The Home Valuation Report is an in-depth analysis detailing your home's value as well as a comparison with similar homes in the area
Home Values in the Area
Average Home Value in this Area
Purchase History
| Date | Buyer | Sale Price | Title Company |
|---|---|---|---|
| Rayburn Virginia M | $136,699 | First American Title Ins Co | |
| Brooks James | $97,000 | First American Title Ins Co | |
| Obrien Mary Lou Hanson | -- | First American Title Ins Co | |
| Hanson Obrien Mary Lou | -- | -- |
Source: Public Records
Mortgage History
| Date | Status | Borrower | Loan Amount |
|---|---|---|---|
| Open | Rayburn Virginia M | $73,000 | |
| Previous Owner | Brooks James | $96,626 |
Source: Public Records
Tax History Compared to Growth
Tax History
| Year | Tax Paid | Tax Assessment Tax Assessment Total Assessment is a certain percentage of the fair market value that is determined by local assessors to be the total taxable value of land and additions on the property. | Land | Improvement |
|---|---|---|---|---|
| 2025 | $4,553 | $443,700 | $327,400 | $116,300 |
| 2024 | $4,553 | $457,100 | $327,400 | $129,700 |
| 2023 | $4,553 | $408,900 | $276,100 | $132,800 |
| 2022 | $4,083 | $431,100 | $278,100 | $153,000 |
| 2021 | $3,686 | $293,100 | $174,400 | $118,700 |
| 2019 | $3,299 | $267,700 | $150,900 | $116,800 |
| 2018 | $3,589 | $253,700 | $141,400 | $112,300 |
| 2017 | $3,053 | $227,100 | $118,500 | $108,600 |
| 2016 | $2,710 | $160,800 | $75,300 | $85,500 |
| 2014 | $2,353 | $155,800 | $75,300 | $80,500 |
| 2013 | $2,353 | $136,100 | $63,500 | $72,600 |
Source: Public Records
Map
Nearby Homes
- 5136 N 30th St
- 5137 N 30th St
- 5301 N 30th St
- 2726 N Bennett St
- 4821 N 27th St
- 4817 N 28th St
- 3018 N Baltimore St
- 3121 N Huson St
- 3301 N Villard St
- 3219 N Shirley St
- 5702 N 33rd St Unit 18B
- 4419 N 26th St
- 3336 N Baltimore St
- 1847 N Shirley St
- 2608 N Stevens St
- 2125 N Highland St
- 1824 N Baltimore St
- 4612 N 21st St
- 4607 N 35th St
- 3502 N Cheyenne St
- 5118 N Mance St
- 5126 N Mance St
- 2714 N Orchard St
- 5114 N Mance St
- 5121 N Mance St
- 5110 N Mance St
- 5018 N 28th St
- 5109 N Mance St
- 5134 N Mance St
- 5109 N 27th St
- 5105 N 27th St
- 5113 N 27th St
- 5101 N 27th St
- 5117 N 27th St
- 5017 N 28th St
- 5014 N 28th St
- 5106 N Mance St
- 5138 N Mance St
- 5121 N 27th St
- 2709 N Orchard St