Estimated Value: $394,000 - $404,929
4
Beds
2
Baths
2,056
Sq Ft
$195/Sq Ft
Est. Value
About This Home
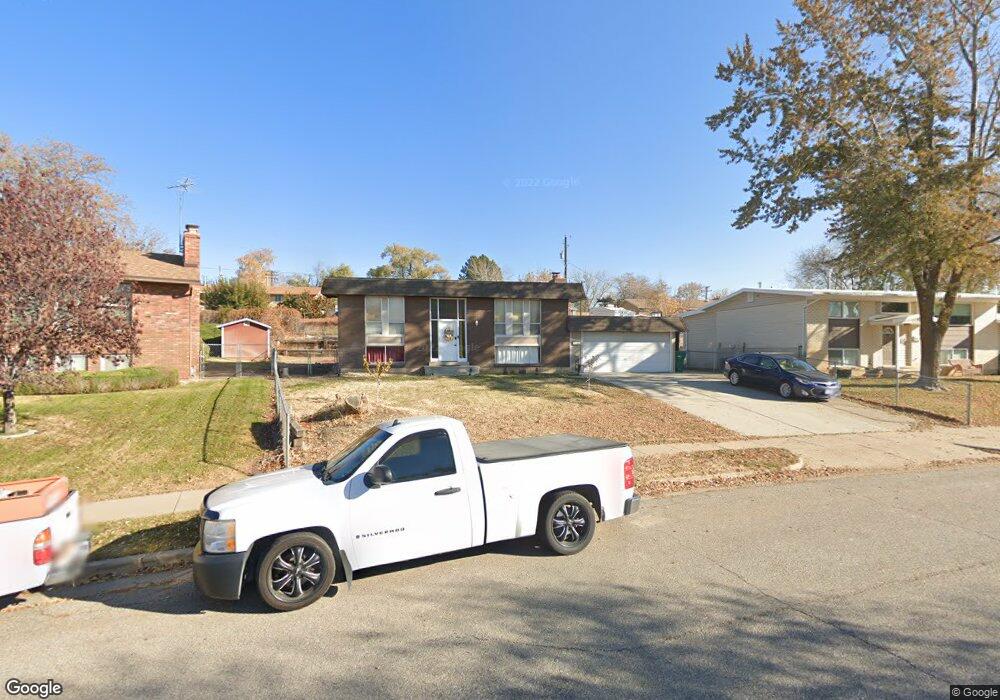
This home is located at 5122 S 2600 W, Roy, UT 84067 and is currently estimated at $401,482, approximately $195 per square foot. 5122 S 2600 W is a home located in Weber County with nearby schools including Lakeview Elementary School, Roy Junior High School, and Roy High School.
Ownership History
Date
Name
Owned For
Owner Type
Purchase Details
Closed on
Jan 5, 2021
Sold by
Silverman Jeff
Bought by
Schmutz Zachary Paul and Schmutz Raquel
Current Estimated Value
Home Financials for this Owner
Home Financials are based on the most recent Mortgage that was taken out on this home.
Original Mortgage
$306,593
Outstanding Balance
$273,587
Interest Rate
2.7%
Mortgage Type
VA
Estimated Equity
$127,895
Purchase Details
Closed on
Jun 30, 2017
Sold by
Gailey Ryan D
Bought by
Silverman Jeff
Home Financials for this Owner
Home Financials are based on the most recent Mortgage that was taken out on this home.
Original Mortgage
$227,260
Interest Rate
4.02%
Mortgage Type
VA
Purchase Details
Closed on
Aug 23, 2013
Sold by
W & W Properties
Bought by
Gailey Ryan D
Home Financials for this Owner
Home Financials are based on the most recent Mortgage that was taken out on this home.
Original Mortgage
$134,516
Interest Rate
4.25%
Mortgage Type
FHA
Purchase Details
Closed on
Jan 19, 2011
Sold by
Willerton Jeremy and Willerton Valerie
Bought by
W & W Properties
Purchase Details
Closed on
Apr 26, 2006
Sold by
W & W Properties
Bought by
Willerton Jeremy and Willerton Valerie
Home Financials for this Owner
Home Financials are based on the most recent Mortgage that was taken out on this home.
Original Mortgage
$132,768
Interest Rate
6.3%
Mortgage Type
Seller Take Back
Purchase Details
Closed on
Feb 23, 2006
Sold by
Payne Tyson S and Payne Amber
Bought by
W & W Properties
Purchase Details
Closed on
Aug 13, 2004
Sold by
Payne Tyson and Payne Amber
Bought by
Payne Tyson S
Home Financials for this Owner
Home Financials are based on the most recent Mortgage that was taken out on this home.
Original Mortgage
$124,200
Interest Rate
5.87%
Mortgage Type
New Conventional
Purchase Details
Closed on
Aug 11, 2004
Sold by
Payne Tyson S
Bought by
Payne Tyson S and Payne Amber
Home Financials for this Owner
Home Financials are based on the most recent Mortgage that was taken out on this home.
Original Mortgage
$124,200
Interest Rate
5.87%
Mortgage Type
New Conventional
Purchase Details
Closed on
Mar 4, 2000
Sold by
Hymas Steven R
Bought by
Payne Tyson and Payne Amber
Home Financials for this Owner
Home Financials are based on the most recent Mortgage that was taken out on this home.
Original Mortgage
$100,000
Interest Rate
8.3%
Mortgage Type
Seller Take Back
Create a Home Valuation Report for This Property
The Home Valuation Report is an in-depth analysis detailing your home's value as well as a comparison with similar homes in the area
Home Values in the Area
Average Home Value in this Area
Purchase History
| Date | Buyer | Sale Price | Title Company |
|---|---|---|---|
| Schmutz Zachary Paul | -- | Old Republic Title | |
| Silverman Jeff | -- | American Secure Title Brigha | |
| Gailey Ryan D | -- | Mountain View Title Ogden | |
| W & W Properties | -- | None Available | |
| Willerton Jeremy | -- | None Available | |
| W & W Properties | -- | Mountain View Title Ogden | |
| Payne Tyson S | -- | Mountain View Title | |
| Payne Tyson S | -- | Mountain View Title | |
| Payne Tyson | -- | Bonneville Title |
Source: Public Records
Mortgage History
| Date | Status | Borrower | Loan Amount |
|---|---|---|---|
| Open | Schmutz Zachary Paul | $306,593 | |
| Previous Owner | Silverman Jeff | $227,260 | |
| Previous Owner | Gailey Ryan D | $134,516 | |
| Previous Owner | Willerton Jeremy | $132,768 | |
| Previous Owner | Payne Tyson S | $124,200 | |
| Previous Owner | Payne Tyson | $100,000 |
Source: Public Records
Tax History Compared to Growth
Tax History
| Year | Tax Paid | Tax Assessment Tax Assessment Total Assessment is a certain percentage of the fair market value that is determined by local assessors to be the total taxable value of land and additions on the property. | Land | Improvement |
|---|---|---|---|---|
| 2025 | $2,310 | $360,808 | $122,630 | $238,178 |
| 2024 | $2,257 | $195,249 | $67,447 | $127,802 |
| 2023 | $2,178 | $188,650 | $64,239 | $124,411 |
| 2022 | $2,341 | $210,650 | $55,729 | $154,921 |
| 2021 | $1,816 | $266,000 | $71,154 | $194,846 |
| 2020 | $1,716 | $231,000 | $71,154 | $159,846 |
| 2019 | $1,792 | $229,000 | $42,710 | $186,290 |
| 2018 | $1,640 | $196,000 | $38,610 | $157,390 |
| 2017 | $1,564 | $175,000 | $38,610 | $136,390 |
| 2016 | $1,405 | $83,552 | $19,238 | $64,314 |
| 2015 | $1,358 | $83,014 | $16,433 | $66,581 |
| 2014 | $1,370 | $83,014 | $16,433 | $66,581 |
Source: Public Records
Map
Nearby Homes