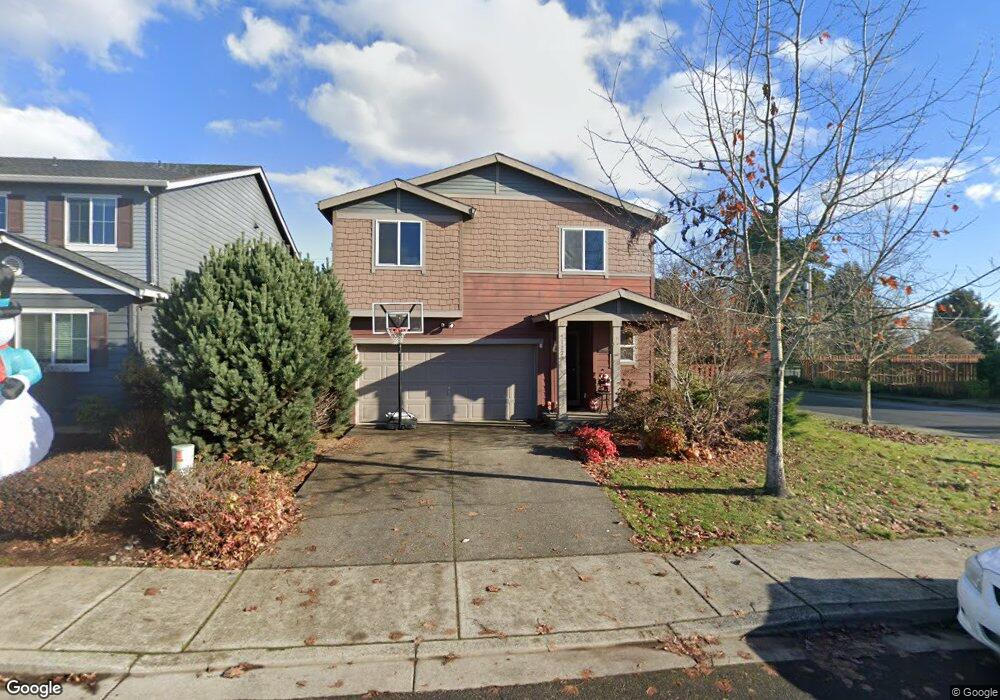
51222 SW Rembrandt Dr Scappoose, OR 97056
Estimated Value: $487,700 - $506,000
3
Beds
3
Baths
1,796
Sq Ft
$278/Sq Ft
Est. Value
About This Home
This home is located at 51222 SW Rembrandt Dr, Scappoose, OR 97056 and is currently estimated at $498,425, approximately $277 per square foot. 51222 SW Rembrandt Dr is a home located in Columbia County with nearby schools including Scappoose High School and Scappoose Adventist School.
Ownership History
Date
Name
Owned For
Owner Type
Purchase Details
Closed on
May 26, 2015
Sold by
Kimball John C and Kimball Lisa B
Bought by
Davis Frank J
Current Estimated Value
Home Financials for this Owner
Home Financials are based on the most recent Mortgage that was taken out on this home.
Original Mortgage
$190,400
Outstanding Balance
$146,039
Interest Rate
3.64%
Mortgage Type
New Conventional
Estimated Equity
$352,386
Purchase Details
Closed on
Jul 24, 2013
Sold by
Burchardt Nevada Michael and Jensen Tammi Jean
Bought by
Kimball John C and Kimball Lisa B
Home Financials for this Owner
Home Financials are based on the most recent Mortgage that was taken out on this home.
Original Mortgage
$201,286
Interest Rate
4.25%
Mortgage Type
FHA
Purchase Details
Closed on
Jul 12, 2011
Sold by
D R Horton Inc Portland Corporation
Bought by
Burchardt Nevada Michael and Jensen Tammi Jean
Home Financials for this Owner
Home Financials are based on the most recent Mortgage that was taken out on this home.
Original Mortgage
$196,910
Interest Rate
4.5%
Mortgage Type
VA
Create a Home Valuation Report for This Property
The Home Valuation Report is an in-depth analysis detailing your home's value as well as a comparison with similar homes in the area
Home Values in the Area
Average Home Value in this Area
Purchase History
| Date | Buyer | Sale Price | Title Company |
|---|---|---|---|
| Davis Frank J | $238,000 | Ticor Title | |
| Kimball John C | $220,000 | Ticor Title | |
| Burchardt Nevada Michael | $205,000 | Ticor Title |
Source: Public Records
Mortgage History
| Date | Status | Borrower | Loan Amount |
|---|---|---|---|
| Open | Davis Frank J | $190,400 | |
| Previous Owner | Kimball John C | $201,286 | |
| Previous Owner | Burchardt Nevada Michael | $196,910 |
Source: Public Records
Tax History Compared to Growth
Tax History
| Year | Tax Paid | Tax Assessment Tax Assessment Total Assessment is a certain percentage of the fair market value that is determined by local assessors to be the total taxable value of land and additions on the property. | Land | Improvement |
|---|---|---|---|---|
| 2025 | $4,244 | $257,760 | $86,750 | $171,010 |
| 2024 | $4,126 | $250,260 | $84,230 | $166,030 |
| 2023 | $4,088 | $242,980 | $87,540 | $155,440 |
| 2022 | $3,916 | $235,910 | $85,000 | $150,910 |
| 2021 | $3,804 | $229,040 | $84,640 | $144,400 |
| 2020 | $3,528 | $222,370 | $86,820 | $135,550 |
| 2019 | $3,436 | $215,900 | $83,500 | $132,400 |
| 2018 | $3,357 | $209,620 | $83,370 | $126,250 |
| 2017 | $3,297 | $203,520 | $80,950 | $122,570 |
| 2016 | $3,255 | $197,600 | $78,590 | $119,010 |
| 2015 | $3,091 | $191,850 | $66,170 | $125,680 |
| 2014 | $3,013 | $186,270 | $62,290 | $123,980 |
Source: Public Records
Map
Nearby Homes
- 51096 SW Klompen St
- 51096 SW Klompen St Unit H138
- 51086 SW Klompen St
- 51082 SW Klompen St
- 33340 SW Rokin Way
- 33366 SW Rokin Way
- 51350 SW Randstad St
- 33362 SW Rokin Way
- 33410 Meadowbrook Dr
- 33298 SW Meadowbrook Dr
- 33279 SW Havlik Dr
- 51459 SE Westlake Dr Unit 102
- Hillsdale Plan at Dutch Canyon
- Aubrey Plan at Dutch Canyon
- Carmichael Plan at Dutch Canyon
- Carlton Plan at Dutch Canyon
- 51540 SE Westlake Dr Unit 56
- 51692 SE 3rd St
- 51361 SE Hood View Dr Unit 139
- 51557 SW Em Watts Rd
- 51234 SW Rembrandt Dr
- 51196 SW Rembrandt Dr
- 33417 SW Holland Dr
- 51194 SW Holland Dr
- 51184 SW Rembrandt Dr
- 51197 SW Rembrandt Dr
- 33403 SW Holland Dr
- 51187 SW Rembrandt Dr
- 51232 SW Rembrandt Dr
- 33395 SW Holland Dr
- 51172 SW Rembrandt Dr
- 51194 SW Amsterdam Ln
- 51220 SW Old Portland Rd
- 51175 SW Rembrandt Dr
- 51200 SW Old Portland Rd
- 51184 SW Amsterdam Ln
- 33383 SW Holland Dr
- 51167 SW Rembrandt Dr
- 51160 SW Rembrandt Dr
- 51266 SW Old Portland Rd