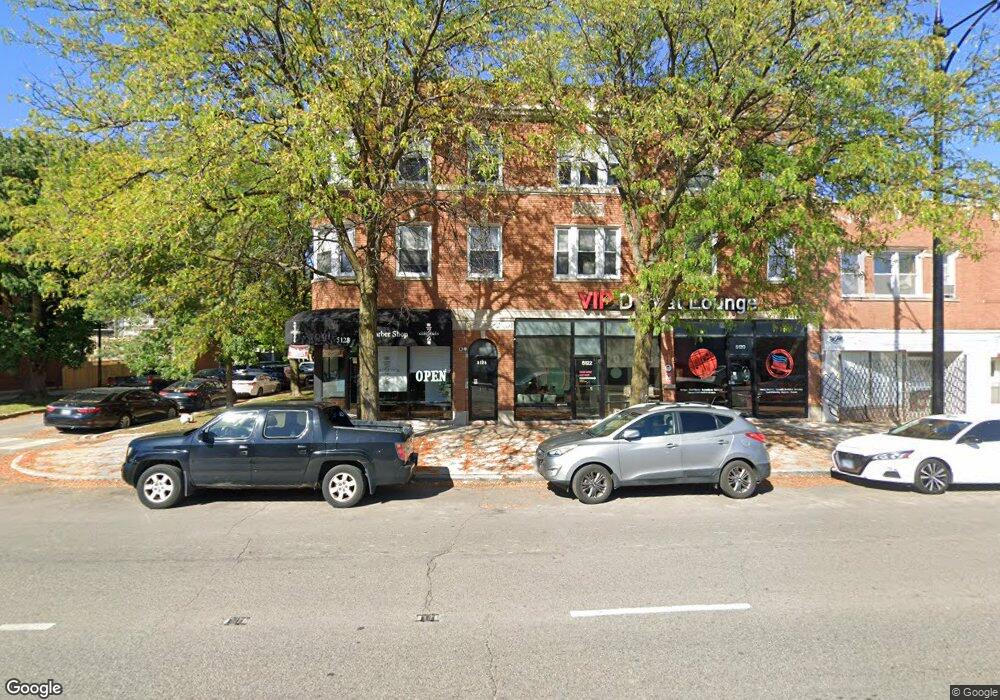
5124 W Irving Park Rd Unit 5124 Chicago, IL 60641
Portage Park NeighborhoodEstimated Value: $213,000 - $310,000
2
Beds
1
Bath
1,200
Sq Ft
$213/Sq Ft
Est. Value
About This Home
This home is located at 5124 W Irving Park Rd Unit 5124, Chicago, IL 60641 and is currently estimated at $255,741, approximately $213 per square foot. 5124 W Irving Park Rd Unit 5124 is a home located in Cook County with nearby schools including Portage Park Elementary School, Schurz High School, and St. Bartholomew School.
Ownership History
Date
Name
Owned For
Owner Type
Purchase Details
Closed on
Aug 13, 2024
Sold by
Wendy Laurusonis Revocable Trust
Bought by
Wfl Properties Llc
Current Estimated Value
Purchase Details
Closed on
Jul 26, 2012
Sold by
Brinklow Simon and Brinklow Katherine Lynne
Bought by
The Wendy Laurusonis Revocable Trust
Purchase Details
Closed on
May 30, 2008
Sold by
Brinklow Gina
Bought by
Brinklow Simon
Purchase Details
Closed on
Nov 15, 2005
Sold by
Lemai Properties Inc
Bought by
Brinklow Simon and Brinklow Gina
Home Financials for this Owner
Home Financials are based on the most recent Mortgage that was taken out on this home.
Original Mortgage
$48,600
Interest Rate
6.17%
Mortgage Type
Stand Alone Second
Create a Home Valuation Report for This Property
The Home Valuation Report is an in-depth analysis detailing your home's value as well as a comparison with similar homes in the area
Home Values in the Area
Average Home Value in this Area
Purchase History
| Date | Buyer | Sale Price | Title Company |
|---|---|---|---|
| Wfl Properties Llc | -- | None Listed On Document | |
| The Wendy Laurusonis Revocable Trust | $90,000 | None Available | |
| Brinklow Simon | -- | None Available | |
| Brinklow Simon | $243,000 | Multiple |
Source: Public Records
Mortgage History
| Date | Status | Borrower | Loan Amount |
|---|---|---|---|
| Previous Owner | Brinklow Simon | $48,600 | |
| Previous Owner | Brinklow Simon | $194,400 |
Source: Public Records
Tax History Compared to Growth
Tax History
| Year | Tax Paid | Tax Assessment Tax Assessment Total Assessment is a certain percentage of the fair market value that is determined by local assessors to be the total taxable value of land and additions on the property. | Land | Improvement |
|---|---|---|---|---|
| 2024 | $3,587 | $23,177 | $1,938 | $21,239 |
| 2023 | $3,496 | $17,000 | $1,829 | $15,171 |
| 2022 | $3,496 | $17,000 | $1,829 | $15,171 |
| 2021 | $3,418 | $16,999 | $1,828 | $15,171 |
| 2020 | $3,121 | $14,010 | $803 | $13,207 |
| 2019 | $3,116 | $15,510 | $803 | $14,707 |
| 2018 | $3,064 | $15,510 | $803 | $14,707 |
| 2017 | $2,684 | $12,466 | $719 | $11,747 |
| 2016 | $2,497 | $12,466 | $719 | $11,747 |
| 2015 | $2,284 | $12,466 | $719 | $11,747 |
| 2014 | $2,413 | $13,004 | $664 | $12,340 |
| 2013 | $2,365 | $13,004 | $664 | $12,340 |
Source: Public Records
Map
Nearby Homes
- 4119 N Leclaire Ave
- 5141 W Dakin St
- 5255 W Belle Plaine Ave
- 5017 W Dakin St
- 5013 W Dakin St
- 5249 W Berteau Ave
- 5142 W Hutchinson St
- 4215 N Lockwood Ave Unit 6
- 4848 W Belle Plaine Ave Unit 2R
- 4904 W Byron St
- 5253 W Cullom Ave
- 5000 W Grace St
- 4015 N Milwaukee Ave Unit 202
- 4932 W Cullom Ave
- 5417 W Dakin St
- 5036 W Pensacola Ave Unit 309
- 5436 W Dakin St
- 5221 W Montrose Ave
- 5410 W Hutchinson St
- 3658 N Laramie Ave
- 4009 N Leamington Ave Unit 4009
- 4009 N Leamington Ave Unit 4009
- 4009 N Leamington Ave Unit 4009
- 4005 N Leamington Ave Unit 4005
- 5124 W Irving Park Rd Unit 5124
- 4005 N Leamington Ave Unit 4005
- 4009 N Leamington Ave Unit 1
- 4009 N Leamington Ave Unit 3
- 5124 W Irving Park Rd Unit 2
- 4009 N Leamington Ave Unit 2
- 5124 W Irving Park Rd Unit 3
- 5120 W Irving Park Rd Unit 1
- 5120 W Irving Park Rd Unit 5120
- 5120 W Irving Park Rd Unit 5120-22
- 5120 W Irving Park Rd
- 4007 N Leamington Ave Unit 4007
- 4007 N Leamington Ave Unit 4007
- 4007 N Leamington Ave Unit 4007
- 4007 N Leamington Ave Unit 1
- 4007 N Leamington Ave Unit 3