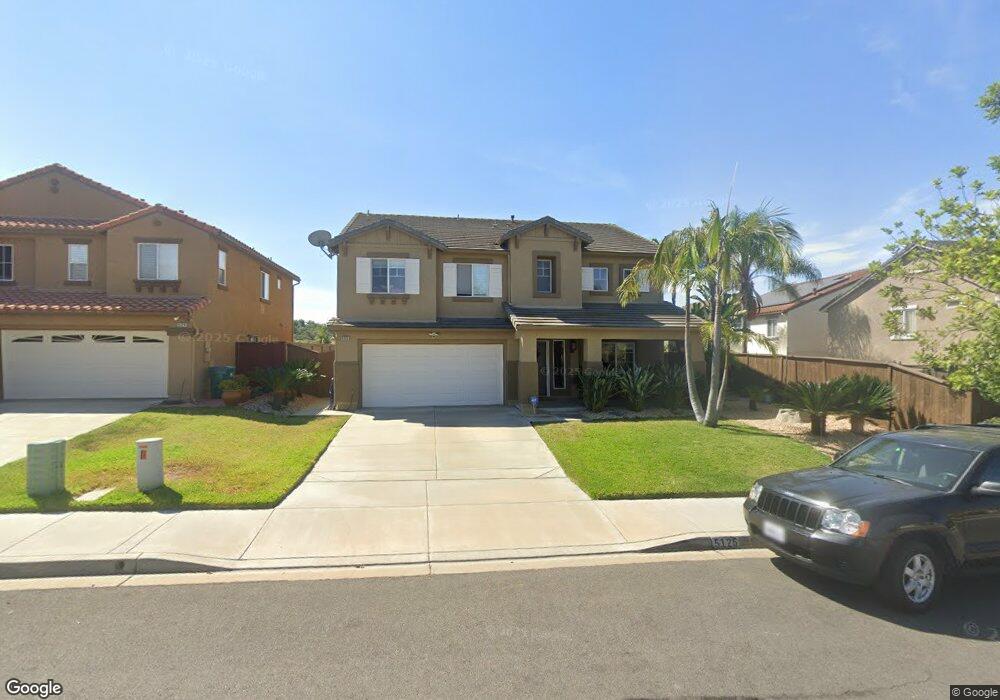
5125 Eliot St Oceanside, CA 92057
North Valley NeighborhoodEstimated Value: $952,000 - $1,065,000
4
Beds
2
Baths
2,570
Sq Ft
$389/Sq Ft
Est. Value
About This Home
This home is located at 5125 Eliot St, Oceanside, CA 92057 and is currently estimated at $999,369, approximately $388 per square foot. 5125 Eliot St is a home located in San Diego County with nearby schools including Reynolds Elementary School, Cesar Chavez Middle School, and El Camino High School.
Ownership History
Date
Name
Owned For
Owner Type
Purchase Details
Closed on
Jun 21, 2022
Sold by
Rice Mari F Tackett
Bought by
Rice Mari F Tackett and Hernandez Katelin N
Current Estimated Value
Purchase Details
Closed on
Apr 29, 2015
Sold by
Ruskovich Antone and Ruskovich Lisa C
Bought by
Rice Richard L and Tackett Rice Mari F
Home Financials for this Owner
Home Financials are based on the most recent Mortgage that was taken out on this home.
Original Mortgage
$488,881
Interest Rate
3.81%
Mortgage Type
FHA
Purchase Details
Closed on
Aug 11, 2003
Sold by
Centex Homes
Bought by
Ruskovich Antone and Ruskovich Lisa C
Home Financials for this Owner
Home Financials are based on the most recent Mortgage that was taken out on this home.
Original Mortgage
$322,700
Interest Rate
6.17%
Mortgage Type
Purchase Money Mortgage
Create a Home Valuation Report for This Property
The Home Valuation Report is an in-depth analysis detailing your home's value as well as a comparison with similar homes in the area
Home Values in the Area
Average Home Value in this Area
Purchase History
| Date | Buyer | Sale Price | Title Company |
|---|---|---|---|
| Rice Mari F Tackett | -- | None Listed On Document | |
| Rice Richard L | -- | None Listed On Document | |
| Rice Richard L | $498,000 | Title 365 Company | |
| Ruskovich Antone | $412,500 | Chicago Title Co |
Source: Public Records
Mortgage History
| Date | Status | Borrower | Loan Amount |
|---|---|---|---|
| Previous Owner | Rice Richard L | $488,881 | |
| Previous Owner | Ruskovich Antone | $322,700 |
Source: Public Records
Tax History
| Year | Tax Paid | Tax Assessment Tax Assessment Total Assessment is a certain percentage of the fair market value that is determined by local assessors to be the total taxable value of land and additions on the property. | Land | Improvement |
|---|---|---|---|---|
| 2025 | $7,817 | $598,390 | $259,511 | $338,879 |
| 2024 | $7,817 | $586,658 | $254,423 | $332,235 |
| 2023 | $7,589 | $575,156 | $249,435 | $325,721 |
| 2022 | $7,489 | $563,880 | $244,545 | $319,335 |
| 2021 | $7,508 | $552,824 | $239,750 | $313,074 |
| 2020 | $7,313 | $547,156 | $237,292 | $309,864 |
| 2019 | $7,135 | $536,429 | $232,640 | $303,789 |
| 2018 | $7,069 | $525,912 | $228,079 | $297,833 |
| 2017 | $7,084 | $515,601 | $223,607 | $291,994 |
| 2016 | $6,931 | $505,492 | $219,223 | $286,269 |
| 2015 | $6,525 | $475,000 | $206,000 | $269,000 |
| 2014 | -- | $425,000 | $185,000 | $240,000 |
Source: Public Records
Map
Nearby Homes
- 1039 Eliot St
- 924 Glendora Dr
- 1479 Puritan Dr
- 1486 Puritan Way
- 1491 Pilgrim Way
- 1121 Midnight Way
- 905 Glendora Dr
- 1359 Corte Alveo
- 0 Indian View Dr
- 868 Panella Ct
- 671 Parker St
- 656 Parker St
- 1241 Breakaway Dr
- 663 Charles Dr
- 5133 Greenbrook St
- 5450 Alexandrine Ct
- 1120 Championship Rd
- 569 Gold Dr
- 5015 Macario Dr
- 4795 Claire Dr
- 5129 Eliot St
- 1022 Longfellow Ct
- 1018 Longfellow Ct
- 5133 Eliot St
- 1014 Longfellow Ct
- 1010 Longfellow Ct
- 5137 Eliot St
- 5124 Eliot St
- 5128 Eliot St
- 5120 Eliot St
- 1027 Eliot St
- 5116 Eliot St
- 1006 Longfellow Ct
- 5141 Eliot St
- 5112 Eliot St
- 1017 Longfellow Ct
- 1031 Eliot St
- 1013 Longfellow Ct
- 1002 Longfellow Ct
- 1009 Longfellow Ct
Your Personal Tour Guide
Ask me questions while you tour the home.