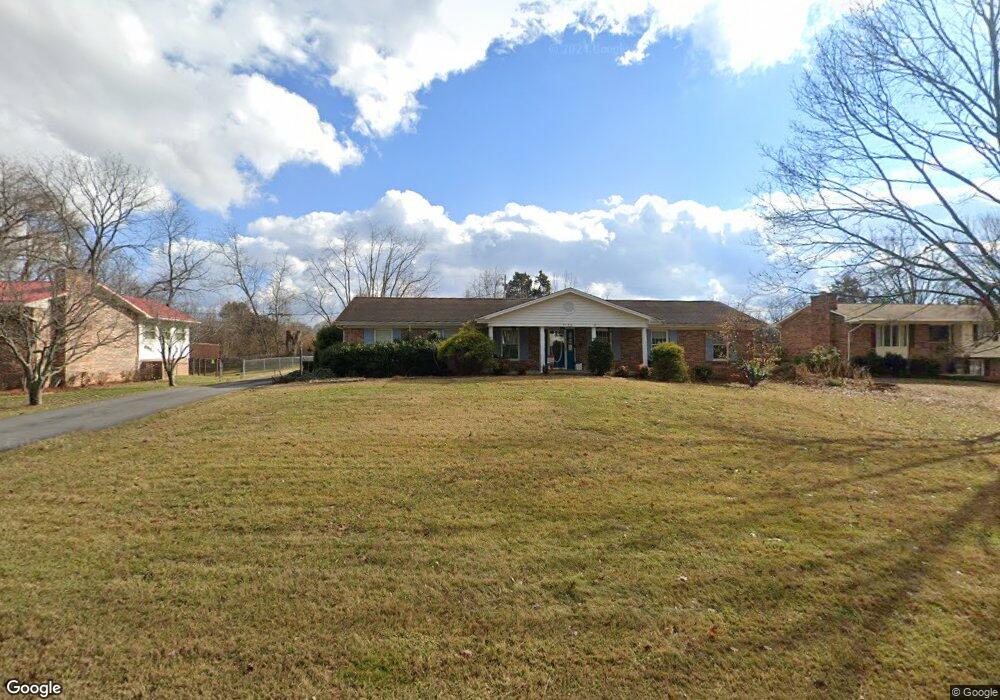
5125 Springview St Kingsport, TN 37664
Estimated Value: $359,431 - $459,000
3
Beds
2
Baths
2,172
Sq Ft
$181/Sq Ft
Est. Value
About This Home
This home is located at 5125 Springview St, Kingsport, TN 37664 and is currently estimated at $394,108, approximately $181 per square foot. 5125 Springview St is a home located in Sullivan County with nearby schools including Indian Springs Elementary School, Sullivan Central Middle School, and Shekinah Christian Academy.
Ownership History
Date
Name
Owned For
Owner Type
Purchase Details
Closed on
Jan 31, 2020
Sold by
Morgan Allan Thomas and Morgan Earnest Neil
Bought by
Lawson Victoria Renee and Lawson Gregory Cullen
Current Estimated Value
Home Financials for this Owner
Home Financials are based on the most recent Mortgage that was taken out on this home.
Original Mortgage
$188,000
Outstanding Balance
$166,839
Interest Rate
3.72%
Mortgage Type
New Conventional
Estimated Equity
$227,269
Purchase Details
Closed on
Dec 30, 2004
Sold by
Honeycutt William P and Honeycutt Charlo
Bought by
Morgan Marvin T
Home Financials for this Owner
Home Financials are based on the most recent Mortgage that was taken out on this home.
Original Mortgage
$125,600
Interest Rate
5.71%
Purchase Details
Closed on
Oct 17, 2003
Create a Home Valuation Report for This Property
The Home Valuation Report is an in-depth analysis detailing your home's value as well as a comparison with similar homes in the area
Home Values in the Area
Average Home Value in this Area
Purchase History
| Date | Buyer | Sale Price | Title Company |
|---|---|---|---|
| Lawson Victoria Renee | $235,000 | Mumpower Ttl & Closing Svcs | |
| Morgan Marvin T | $158,000 | -- | |
| -- | $130,000 | -- |
Source: Public Records
Mortgage History
| Date | Status | Borrower | Loan Amount |
|---|---|---|---|
| Open | Lawson Victoria Renee | $188,000 | |
| Previous Owner | -- | $125,600 |
Source: Public Records
Tax History Compared to Growth
Tax History
| Year | Tax Paid | Tax Assessment Tax Assessment Total Assessment is a certain percentage of the fair market value that is determined by local assessors to be the total taxable value of land and additions on the property. | Land | Improvement |
|---|---|---|---|---|
| 2024 | $1,357 | $54,350 | $6,875 | $47,475 |
| 2023 | $1,308 | $54,350 | $6,875 | $47,475 |
| 2022 | $1,308 | $54,350 | $6,875 | $47,475 |
| 2021 | $1,308 | $54,350 | $6,875 | $47,475 |
| 2020 | $1,248 | $54,350 | $6,875 | $47,475 |
| 2019 | $1,248 | $48,550 | $6,875 | $41,675 |
| 2018 | $1,238 | $48,550 | $6,875 | $41,675 |
| 2017 | $1,238 | $48,550 | $6,875 | $41,675 |
| 2016 | $1,146 | $44,500 | $6,875 | $37,625 |
| 2014 | $1,026 | $44,512 | $0 | $0 |
Source: Public Records
Map
Nearby Homes
- 0 Moody Dr
- 5028 Dublin Rd
- 128 Southridge Dr
- 121 Southridge Dr
- 376 Cain Dr
- 295 Southridge Dr
- 160 Sugarcane Ln
- 172 Sugarcane Ln
- 845 Emory Church Rd
- Lot 3 Country Dr
- Lot 2 Country Dr
- Lot 21 Country Dr
- 509 Amelia Ct
- Madison Plan at Fieldcrest Acres
- Salem Plan at Fieldcrest Acres
- Pamlico Plan at Fieldcrest Acres
- Cali Plan at Fieldcrest Acres
- Allex Plan at Fieldcrest Acres
- Hanover Plan at Fieldcrest Acres
- Richland Plan at Fieldcrest Acres
- 5129 Springview St
- 5121 Springview St
- 5133 Springview St
- 5122 Springview St
- 5126 Springview St
- 5118 Springview St
- 5113 Springview St
- 5137 Springview St
- 5130 Springview St
- 5114 Springview St
- 5104 Foxwood Ln
- 5123 Moody Dr
- 5110 Springview St
- 5108 Foxwood Ln
- 5109 Springview St
- 5141 Springview St
- 5124 Moody Dr
- 0 Foxwood Ln
- 5106 Springview St
- 5112 Foxwood Ln