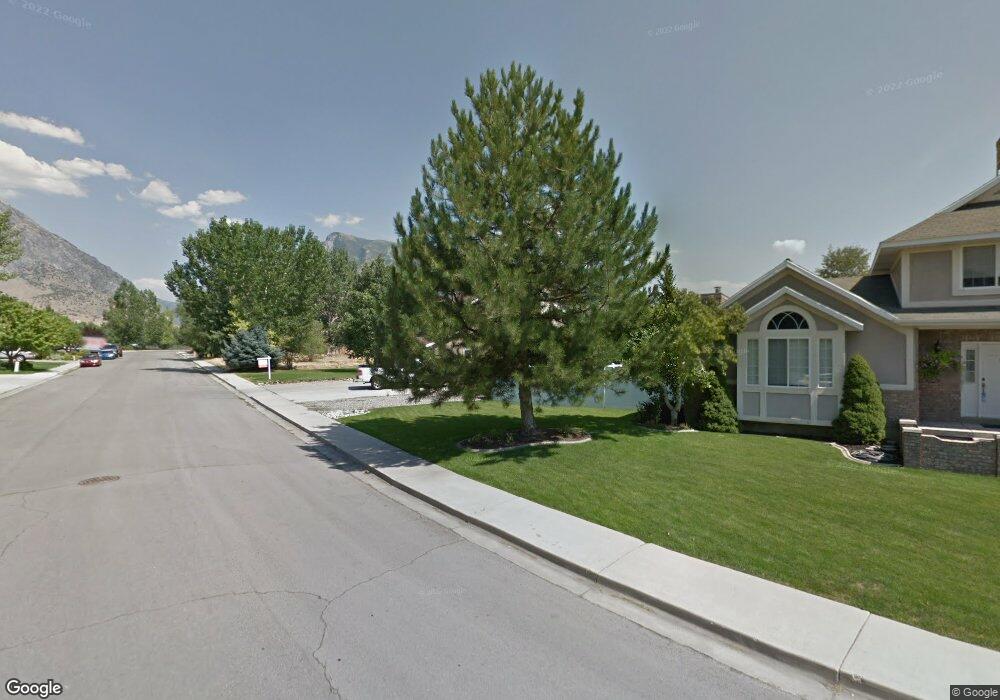
5125 W Jerling Dr Highland, UT 84003
Estimated Value: $814,000 - $876,000
5
Beds
4
Baths
3,026
Sq Ft
$279/Sq Ft
Est. Value
About This Home
This home is located at 5125 W Jerling Dr, Highland, UT 84003 and is currently estimated at $844,861, approximately $279 per square foot. 5125 W Jerling Dr is a home located in Utah County with nearby schools including Highland Elementary School, Mountain Ridge Junior High School, and Lone Peak High School.
Ownership History
Date
Name
Owned For
Owner Type
Purchase Details
Closed on
Jul 16, 2014
Sold by
Dominguez Samuel and Dominguez Tiffany
Bought by
Smith Karen Sue
Current Estimated Value
Purchase Details
Closed on
Aug 3, 2006
Sold by
Bonham Robert R and Bonham Mary E
Bought by
Dominguez Samuel and Dominguez Tiffany
Home Financials for this Owner
Home Financials are based on the most recent Mortgage that was taken out on this home.
Original Mortgage
$239,900
Interest Rate
7.12%
Mortgage Type
New Conventional
Purchase Details
Closed on
May 30, 2002
Sold by
Fitzgerald Elizabeth Ann
Bought by
Bonham Robert R and Bonham Mary E
Purchase Details
Closed on
Sep 25, 1998
Sold by
Fitzgerald Hal W and Fitzgerald Elizabeth Ann
Bought by
Fitzgerald W Hal and Fitzgerald Elizabeth Ann
Home Financials for this Owner
Home Financials are based on the most recent Mortgage that was taken out on this home.
Original Mortgage
$130,325
Interest Rate
6.88%
Create a Home Valuation Report for This Property
The Home Valuation Report is an in-depth analysis detailing your home's value as well as a comparison with similar homes in the area
Home Values in the Area
Average Home Value in this Area
Purchase History
| Date | Buyer | Sale Price | Title Company |
|---|---|---|---|
| Smith Karen Sue | -- | North American Title | |
| Dominguez Samuel | -- | Affiliated First Title Comp | |
| Bonham Robert R | -- | First American Title Insuran | |
| Fitzgerald W Hal | -- | -- |
Source: Public Records
Mortgage History
| Date | Status | Borrower | Loan Amount |
|---|---|---|---|
| Previous Owner | Dominguez Samuel | $239,900 | |
| Previous Owner | Fitzgerald W Hal | $130,325 |
Source: Public Records
Tax History
| Year | Tax Paid | Tax Assessment Tax Assessment Total Assessment is a certain percentage of the fair market value that is determined by local assessors to be the total taxable value of land and additions on the property. | Land | Improvement |
|---|---|---|---|---|
| 2025 | $3,327 | $412,005 | -- | -- |
| 2024 | $3,133 | $410,905 | $0 | $0 |
| 2023 | $3,329 | $417,395 | $0 | $0 |
| 2022 | $3,329 | $430,155 | $0 | $0 |
| 2021 | $2,765 | $532,100 | $240,500 | $291,600 |
| 2020 | $2,653 | $500,700 | $209,100 | $291,600 |
| 2019 | $2,237 | $441,700 | $188,100 | $253,600 |
| 2018 | $2,206 | $413,900 | $160,300 | $253,600 |
| 2017 | $1,880 | $188,320 | $0 | $0 |
| 2016 | $2,136 | $199,925 | $0 | $0 |
| 2015 | $2,102 | $186,505 | $0 | $0 |
| 2014 | $1,945 | $171,050 | $0 | $0 |
Source: Public Records
Map
Nearby Homes
- 10685 N Jerling Dr
- 10861 N Panorama Dr
- 10825 N Black Shale Loop Unit 503
- 5159 W 11000 N
- 5077 W 11000 N
- 10862 N Marble Manor
- 4796 W Canyon View Dr
- 10507 N 5470 W
- 10919 N Town Center Blvd
- 10535 Janie Ln
- 5538 W Naples Dr Unit 125
- 5538 W Turin Ln
- 4673 W Canyon View Dr
- 5246 W 11200 N Unit 1
- 5984 W 11200 N Unit 1
- 5378 W 10130 N
- 11107 Manor Dr Unit 1
- 5046 W Jonathon Rd Unit 10
- 4956 W Gallatin Way
- 5983 W 11270 N Unit 4
- 5155 W Jerling Dr
- 5098 Jerling Cir
- 5094 Jerling Cir
- 5124 W Jerling Dr
- 10688 N Jerling Dr
- 5134 W Jerling Dr
- 5114 W Jerling Dr
- 5105 W Jerling Dr
- 5097 Jerling Cir
- 10673 N Jerling Dr
- 10664 N Jerling Dr
- 10697 N Jerling Dr
- 5104 W Jerling Dr
- 10687 N Jerling Dr
- 5087 W Jerling Cir
- 5087 Jerling Cir
- 10677 N Jerling Dr
- 5095 W Jerling Dr
- 5087 E Jerling Dr
- 10652 N Jerling Dr
Your Personal Tour Guide
Ask me questions while you tour the home.