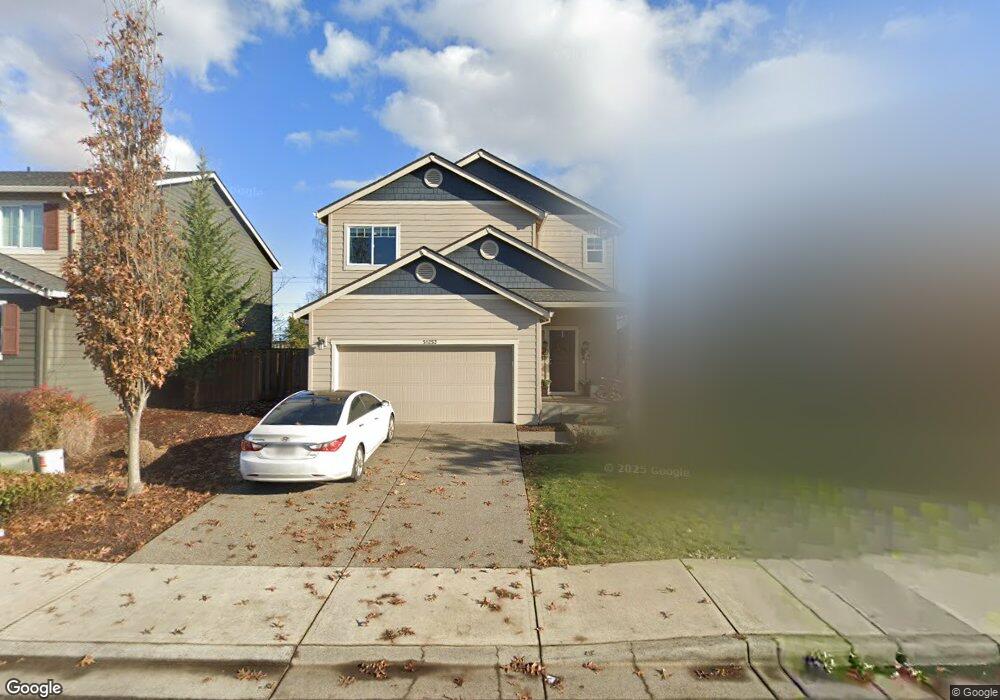
51252 SW Rembrandt Dr Scappoose, OR 97056
Estimated Value: $528,000 - $580,000
4
Beds
3
Baths
2,267
Sq Ft
$242/Sq Ft
Est. Value
About This Home
This home is located at 51252 SW Rembrandt Dr, Scappoose, OR 97056 and is currently estimated at $549,291, approximately $242 per square foot. 51252 SW Rembrandt Dr is a home located in Columbia County with nearby schools including Scappoose High School and Scappoose Adventist School.
Ownership History
Date
Name
Owned For
Owner Type
Purchase Details
Closed on
Jun 25, 2020
Sold by
Isaksen Jason C and Isaksen Brianna
Bought by
Isaksen Jason C and Isaksen Brianna
Current Estimated Value
Home Financials for this Owner
Home Financials are based on the most recent Mortgage that was taken out on this home.
Original Mortgage
$305,000
Outstanding Balance
$269,761
Interest Rate
3.2%
Mortgage Type
New Conventional
Estimated Equity
$279,530
Purchase Details
Closed on
Jan 26, 2017
Sold by
Luper Roberta
Bought by
Isaksen Jason C and Bules Brianna
Home Financials for this Owner
Home Financials are based on the most recent Mortgage that was taken out on this home.
Original Mortgage
$305,100
Interest Rate
4.16%
Mortgage Type
New Conventional
Purchase Details
Closed on
Jan 19, 2015
Sold by
D R Horton Inc Portland
Bought by
Luper Roberta
Home Financials for this Owner
Home Financials are based on the most recent Mortgage that was taken out on this home.
Original Mortgage
$215,099
Interest Rate
3.5%
Mortgage Type
FHA
Create a Home Valuation Report for This Property
The Home Valuation Report is an in-depth analysis detailing your home's value as well as a comparison with similar homes in the area
Home Values in the Area
Average Home Value in this Area
Purchase History
| Date | Buyer | Sale Price | Title Company |
|---|---|---|---|
| Isaksen Jason C | -- | Wfg Title | |
| Isaksen Jason C | $339,000 | Columbia County Title | |
| Luper Roberta | $251,400 | First American Title |
Source: Public Records
Mortgage History
| Date | Status | Borrower | Loan Amount |
|---|---|---|---|
| Open | Isaksen Jason C | $305,000 | |
| Closed | Isaksen Jason C | $305,100 | |
| Previous Owner | Luper Roberta | $215,099 |
Source: Public Records
Tax History Compared to Growth
Tax History
| Year | Tax Paid | Tax Assessment Tax Assessment Total Assessment is a certain percentage of the fair market value that is determined by local assessors to be the total taxable value of land and additions on the property. | Land | Improvement |
|---|---|---|---|---|
| 2025 | $5,230 | $317,640 | $94,070 | $223,570 |
| 2024 | $5,085 | $308,390 | $91,330 | $217,060 |
| 2023 | $5,037 | $299,410 | $96,080 | $203,330 |
| 2022 | $4,825 | $290,690 | $93,290 | $197,400 |
| 2021 | $4,687 | $282,230 | $91,060 | $191,170 |
| 2020 | $4,347 | $274,010 | $97,100 | $176,910 |
| 2019 | $4,233 | $266,030 | $92,720 | $173,310 |
| 2018 | $4,137 | $258,290 | $91,410 | $166,880 |
| 2017 | $4,063 | $250,770 | $88,740 | $162,030 |
| 2016 | $4,011 | $243,470 | $86,150 | $157,320 |
| 2015 | $3,789 | $236,380 | $83,550 | $152,830 |
Source: Public Records
Map
Nearby Homes
- 51096 SW Klompen St
- 51096 SW Klompen St Unit H138
- 51086 SW Klompen St
- 33340 SW Rokin Way
- 51082 SW Klompen St
- 51350 SW Randstad St
- 33366 SW Rokin Way
- 33362 SW Rokin Way
- 33410 Meadowbrook Dr
- 33279 SW Havlik Dr
- 33298 SW Meadowbrook Dr
- Hillsdale Plan at Dutch Canyon
- Aubrey Plan at Dutch Canyon
- Carmichael Plan at Dutch Canyon
- Carlton Plan at Dutch Canyon
- 51459 SE Westlake Dr Unit 102
- 51557 SW Em Watts Rd
- 51540 SE Westlake Dr Unit 56
- 51692 SE 3rd St
- 51361 SE Hood View Dr Unit 139
- 33406 SW Rotterdam St
- 51152 SW Klompen St
- 51169 SW Klompen St
- 51111 SW Klompen St
- 51276 SW Rembrandt Dr
- 51262 SW Rembrandt Dr
- 33371 SW Rotterdam St
- 33333 SW Rotterdam St
- 51242 SW Rembrandt Dr
- 33330 SW Rotterdam St
- 33363 SW Rotterdam St
- 51213 SW Tulip St
- 33374 SW Rotterdam St
- 33358 SW Rotterdam St
- 33363 SW Rotterdam St Unit Lot55
- 51263 SW Rembrandt Dr
- 51132 SW Klompen St
- 51195 SW Klompen St
- 33341 SW Holland Dr
- 33340 SW Rotterdam St