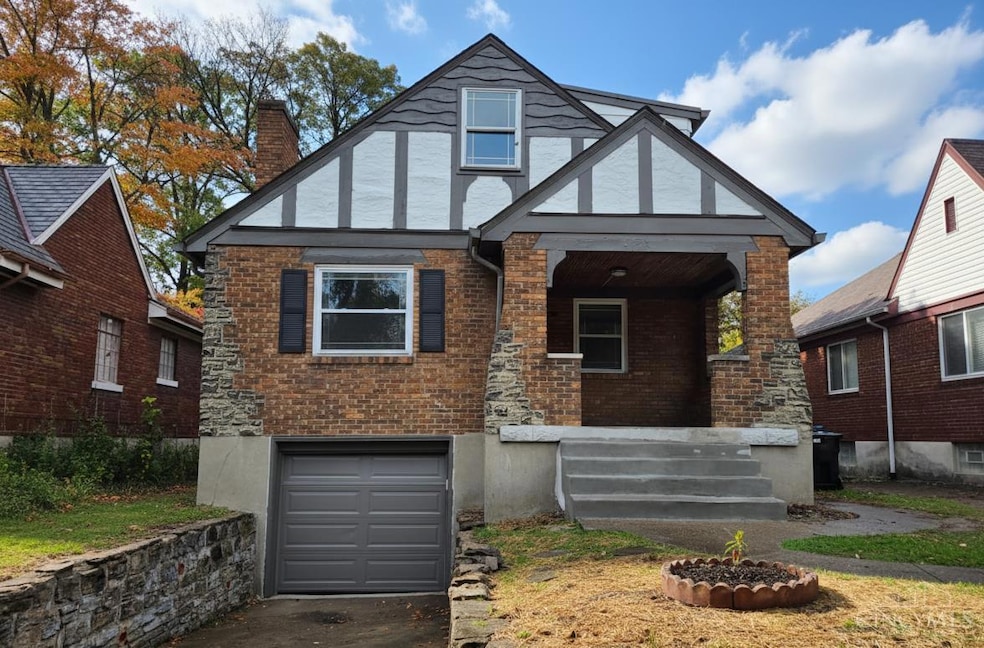
5126 Grafton Ave Cincinnati, OH 45237
Bond Hill NeighborhoodEstimated payment $1,562/month
Highlights
- Main Floor Bedroom
- Tudor Architecture
- Bathtub with Shower
- Walnut Hills High School Rated A+
- No HOA
- Forced Air Heating and Cooling System
About This Home
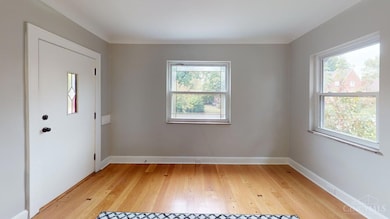
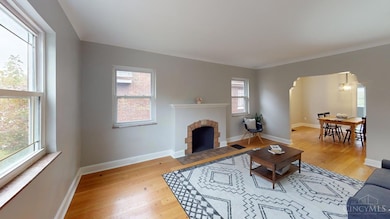
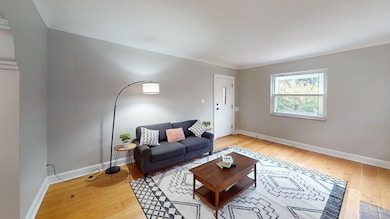
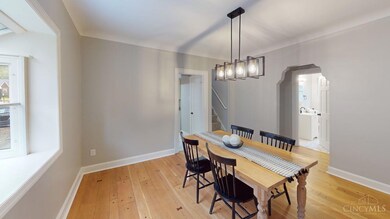
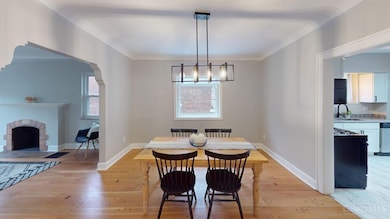
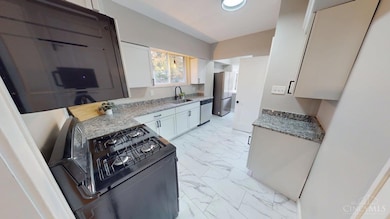
Welcome home to this stunning renovation in the heart of Bond Hill! This beautifully updated 3-bedroom, 2-bath home perfectly blends modern finishes with timeless charm. The bright and airy kitchen features crisp white shaker cabinets, granite countertops, and stainless-steel appliances, making it the perfect space for cooking and entertaining. The floor plan flows effortlessly into the living and dining areas, highlighting the home's character and warmth. Every detail has been thoughtfully considerednew carpet, fresh paint, and stylish light fixtures throughout. Step outside to the paver patio, ideal for relaxing or hosting guests in your private backyard. With its combination of classic appeal and modern convenience, this move-in-ready home offers exceptional value in a growing neighborhood. Don't miss your chance to own this charming Bond Hill gem! Owner is a licensed agent.
Listing Agent
Keller Williams Seven Hills Re License #2020000764 Listed on: 10/29/2025

Home Details
Home Type
- Single Family
Est. Annual Taxes
- $2,892
Year Built
- Built in 1930
Lot Details
- 4,530 Sq Ft Lot
- Lot Dimensions are 40x112
Parking
- 1 Car Garage
- Front Facing Garage
- Driveway
Home Design
- Tudor Architecture
- Brick Exterior Construction
- Block Foundation
- Shingle Roof
- Stone
Interior Spaces
- 2,221 Sq Ft Home
- 2-Story Property
- Vinyl Clad Windows
- Partially Finished Basement
- Basement Fills Entire Space Under The House
Bedrooms and Bathrooms
- 3 Bedrooms
- Main Floor Bedroom
- 2 Full Bathrooms
- Bathtub with Shower
Utilities
- Forced Air Heating and Cooling System
- Heating System Uses Gas
- Gas Water Heater
Community Details
- No Home Owners Association
Map
Home Values in the Area
Average Home Value in this Area
Tax History
| Year | Tax Paid | Tax Assessment Tax Assessment Total Assessment is a certain percentage of the fair market value that is determined by local assessors to be the total taxable value of land and additions on the property. | Land | Improvement |
|---|---|---|---|---|
| 2024 | $2,893 | $47,044 | $4,753 | $42,291 |
| 2023 | $2,879 | $47,044 | $4,753 | $42,291 |
| 2022 | $1,379 | $20,122 | $4,652 | $15,470 |
| 2021 | $1,325 | $20,122 | $4,652 | $15,470 |
| 2020 | $1,390 | $20,122 | $4,652 | $15,470 |
| 2019 | $1,419 | $18,806 | $4,347 | $14,459 |
| 2018 | $1,421 | $18,806 | $4,347 | $14,459 |
| 2017 | $1,325 | $18,806 | $4,347 | $14,459 |
| 2016 | $1,439 | $20,154 | $4,834 | $15,320 |
| 2015 | $1,298 | $20,154 | $4,834 | $15,320 |
| 2014 | $1,307 | $20,154 | $4,834 | $15,320 |
| 2013 | $1,481 | $22,460 | $5,432 | $17,028 |
Property History
| Date | Event | Price | List to Sale | Price per Sq Ft |
|---|---|---|---|---|
| 11/07/2025 11/07/25 | Pending | -- | -- | -- |
| 10/29/2025 10/29/25 | For Sale | $250,000 | -- | $113 / Sq Ft |
Purchase History
| Date | Type | Sale Price | Title Company |
|---|---|---|---|
| Warranty Deed | $160,000 | None Listed On Document | |
| Warranty Deed | $160,000 | None Listed On Document | |
| Warranty Deed | $119,000 | None Available | |
| Deed | $82,000 | Lakeside Title & Escrow Agen | |
| Warranty Deed | $72,000 | -- |
Mortgage History
| Date | Status | Loan Amount | Loan Type |
|---|---|---|---|
| Open | $144,000 | No Value Available | |
| Closed | $144,000 | No Value Available | |
| Closed | $160,000 | New Conventional | |
| Previous Owner | $95,200 | Unknown | |
| Previous Owner | $85,750 | FHA |
Source: MLS of Greater Cincinnati (CincyMLS)
MLS Number: 1860290
APN: 119-0A02-0089
Disclaimer: Certain information contained herein is derived from information provided by parties other than Homes.com. All information provided is deemed reliable, but is not guaranteed to be accurate and should be independently verified.
![]() The data relating to real estate for sale on this website comes in part from the Broker Reciprocity programs of the MLS of Greater Cincinnati, Inc.. Those listings held by brokerage firms other than Ten-X are marked with the Broker Reciprocity logo and house icon. The properties displayed may not be all of the properties available through Broker Reciprocity.
The data relating to real estate for sale on this website comes in part from the Broker Reciprocity programs of the MLS of Greater Cincinnati, Inc.. Those listings held by brokerage firms other than Ten-X are marked with the Broker Reciprocity logo and house icon. The properties displayed may not be all of the properties available through Broker Reciprocity.
IDX information is provided exclusively for personal, non-commercial use, and may not be used for any purpose other than to identify prospective properties consumers may be interested in purchasing.
Information is deemed reliable but not guaranteed.
Ten-X does not display the entire Cincinnati MLS Broker Reciprocity™ database on this web site. The listings of some real estate brokerage firms have been excluded.
Copyright 2025, MLS of Greater Cincinnati, Inc. All rights reserved
- 5120 Lillian Dr
- 5018 Lillian Dr
- 1917 Truitt Ave
- 1932 Truitt Ave
- 5016 Newfield Ave
- 1870 Dalewood Place
- 1855 Dalewood Place
- 1715 Portman Ave
- 5728 Warren Ave
- 2011 Dale Rd
- 1730 Dale Rd
- 1744 Northampton Dr
- 1978 Garden Ln
- 2014 Faith St
- 5447 Grafton Ave
- 5621 Rolston Ave
- 5300 Reading Rd
- 5418 Reading Rd
- 5725 Carthage Ave
- 5432 Rolston Ave