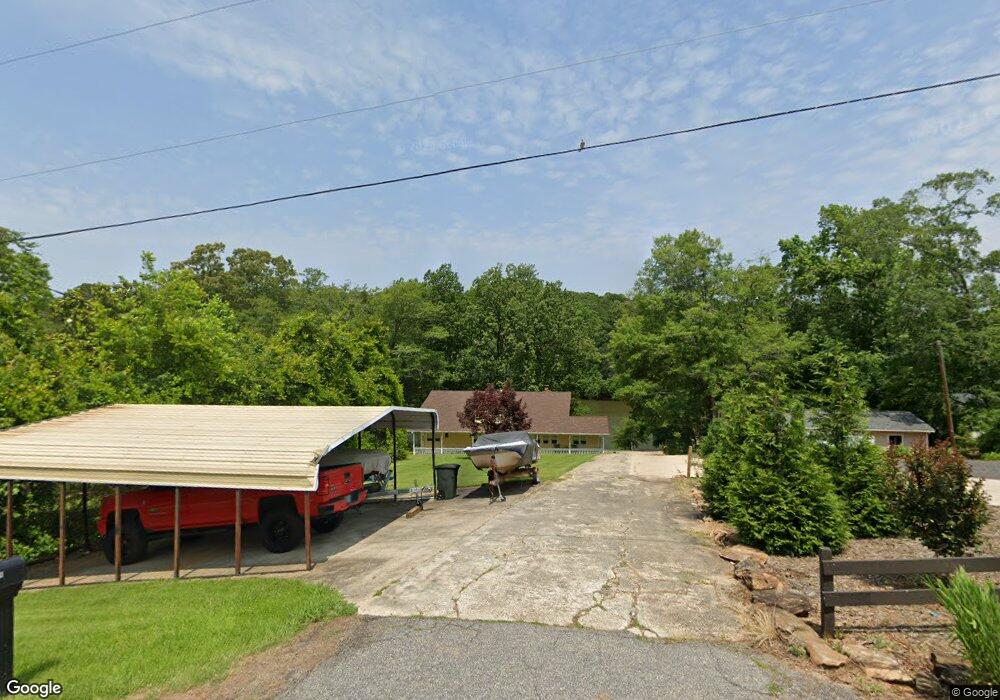
5126 Patterson Rd Anderson, SC 29625
Estimated Value: $428,000 - $525,000
4
Beds
3
Baths
2,628
Sq Ft
$184/Sq Ft
Est. Value
About This Home
This home is located at 5126 Patterson Rd, Anderson, SC 29625 and is currently estimated at $484,500, approximately $184 per square foot. 5126 Patterson Rd is a home located in Anderson County with nearby schools including Pendleton High School.
Ownership History
Date
Name
Owned For
Owner Type
Purchase Details
Closed on
May 3, 2006
Sold by
Show Me The Money Inc
Bought by
Ashley Norman Chris and Ashley Norman
Current Estimated Value
Home Financials for this Owner
Home Financials are based on the most recent Mortgage that was taken out on this home.
Original Mortgage
$202,410
Outstanding Balance
$117,160
Interest Rate
6.39%
Mortgage Type
Future Advance Clause Open End Mortgage
Estimated Equity
$367,340
Purchase Details
Closed on
Apr 24, 2006
Sold by
Addison Sherry R and Addison Robin Dwain
Bought by
Shoe Me The Money Inc
Home Financials for this Owner
Home Financials are based on the most recent Mortgage that was taken out on this home.
Original Mortgage
$202,410
Outstanding Balance
$117,160
Interest Rate
6.39%
Mortgage Type
Future Advance Clause Open End Mortgage
Estimated Equity
$367,340
Purchase Details
Closed on
Apr 11, 2003
Sold by
Mo Jo Dev Corp
Bought by
Show Me The Money Inc
Purchase Details
Closed on
Feb 10, 2003
Sold by
Master In Equity
Bought by
Show Me The Money Inc
Create a Home Valuation Report for This Property
The Home Valuation Report is an in-depth analysis detailing your home's value as well as a comparison with similar homes in the area
Home Values in the Area
Average Home Value in this Area
Purchase History
| Date | Buyer | Sale Price | Title Company |
|---|---|---|---|
| Ashley Norman Chris | $224,900 | None Available | |
| Shoe Me The Money Inc | $168,717 | None Available | |
| Show Me The Money Inc | $275,000 | -- | |
| Show Me The Money Inc | $168,717 | -- |
Source: Public Records
Mortgage History
| Date | Status | Borrower | Loan Amount |
|---|---|---|---|
| Open | Ashley Norman Chris | $202,410 | |
| Closed | Shoe Me The Money Inc | $202,410 |
Source: Public Records
Tax History Compared to Growth
Tax History
| Year | Tax Paid | Tax Assessment Tax Assessment Total Assessment is a certain percentage of the fair market value that is determined by local assessors to be the total taxable value of land and additions on the property. | Land | Improvement |
|---|---|---|---|---|
| 2024 | $1,178 | $10,340 | $4,610 | $5,730 |
| 2023 | $1,178 | $10,340 | $4,610 | $5,730 |
| 2022 | $1,033 | $10,340 | $4,610 | $5,730 |
| 2021 | $3,146 | $12,840 | $5,400 | $7,440 |
| 2020 | $3,126 | $12,840 | $5,400 | $7,440 |
| 2019 | $3,126 | $12,840 | $5,400 | $7,440 |
| 2018 | $3,081 | $12,840 | $5,400 | $7,440 |
| 2017 | -- | $12,840 | $5,400 | $7,440 |
| 2016 | $2,629 | $12,320 | $4,800 | $7,520 |
| 2015 | $2,636 | $12,320 | $4,800 | $7,520 |
| 2014 | $2,638 | $12,320 | $4,800 | $7,520 |
Source: Public Records
Map
Nearby Homes
- 5028 Patterson Rd
- 360 Cann Rd
- 1011 Arrowhead Point Rd
- 5924 S Carolina 187
- 108 Grindstone Way
- 116 Dean Rd
- 1011 Shadow Ln
- 1103 Burns Bridge Rd
- 140 Robinhood Rd
- 136 Robinhood Rd
- 531 Fants Grove Rd
- 04 & 05 Camp Creek Rd
- Lots 4 & 5 Camp Creek Rd Unit Lots 4 & 5
- 00 Camp Creek Rd
- 114 Ann Rd
- 02 Pinetree Rd
- 01 Pinetree Rd
- Pinetree Rd
- Pinetree Rd
- 5655 Hix Rd
- 5124 Patterson Rd
- 5122 Patterson Rd
- 5130 Patterson Rd
- 5132 Patterson Rd
- 5132 Patterson Rd
- 5132 Patterson Rd
- 5118 Patterson Rd
- 5116 Patterson Rd
- 114 Gary Rd
- 5114 Patterson Rd
- 5112 Patterson Rd
- 5110 Patterson Rd
- 334 Cann Rd
- 332 Cann Rd
- 5105 Patterson Rd
- 5108 Patterson Rd
- 336 Cann Rd
- 5106 Patterson Rd
- 106 Gary Rd
- 338 Cann Rd