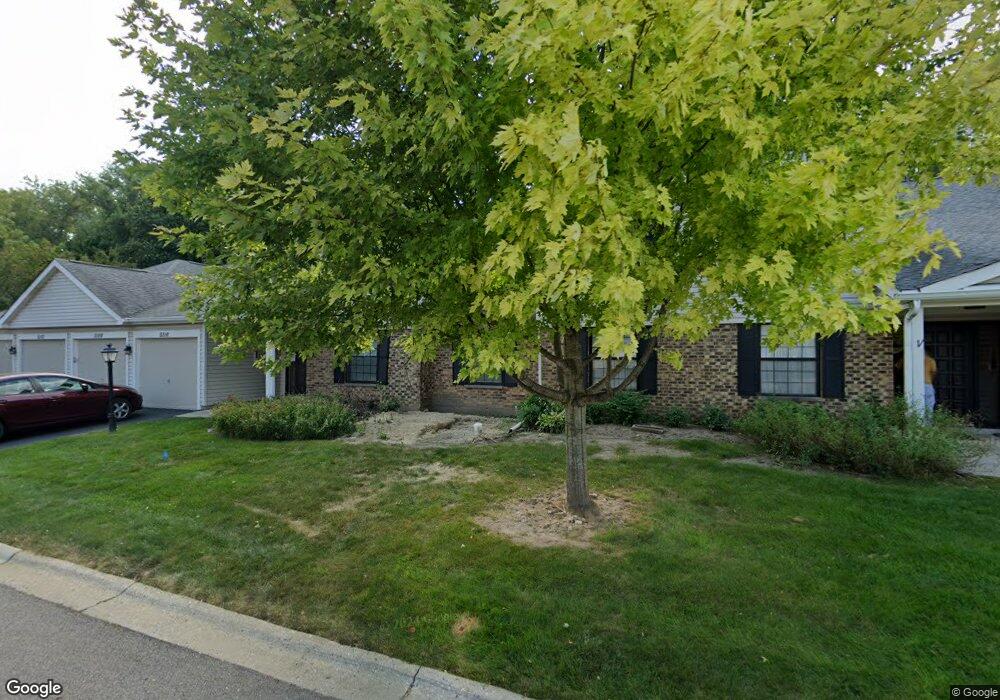
5128 Coventry Ln Unit 9D1 Gurnee, IL 60031
Estimated Value: $204,000 - $243,000
2
Beds
2
Baths
1,136
Sq Ft
$192/Sq Ft
Est. Value
About This Home
This home is located at 5128 Coventry Ln Unit 9D1, Gurnee, IL 60031 and is currently estimated at $218,171, approximately $192 per square foot. 5128 Coventry Ln Unit 9D1 is a home located in Lake County with nearby schools including Spaulding Elementary School, Viking Middle School, and Warren Township High School.
Ownership History
Date
Name
Owned For
Owner Type
Purchase Details
Closed on
Dec 22, 2023
Sold by
Sheets Gregory
Bought by
Nava Lissette
Current Estimated Value
Home Financials for this Owner
Home Financials are based on the most recent Mortgage that was taken out on this home.
Original Mortgage
$166,000
Outstanding Balance
$163,132
Interest Rate
7.29%
Mortgage Type
New Conventional
Estimated Equity
$55,039
Purchase Details
Closed on
Oct 14, 2004
Sold by
Erlenborn Deidre R
Bought by
Sheets Gregory
Home Financials for this Owner
Home Financials are based on the most recent Mortgage that was taken out on this home.
Original Mortgage
$129,650
Interest Rate
5.93%
Mortgage Type
Unknown
Purchase Details
Closed on
Oct 23, 2001
Sold by
Paulsen Margaret A
Bought by
Erlenborn Deidre R
Home Financials for this Owner
Home Financials are based on the most recent Mortgage that was taken out on this home.
Original Mortgage
$96,000
Interest Rate
6.72%
Mortgage Type
FHA
Create a Home Valuation Report for This Property
The Home Valuation Report is an in-depth analysis detailing your home's value as well as a comparison with similar homes in the area
Home Values in the Area
Average Home Value in this Area
Purchase History
| Date | Buyer | Sale Price | Title Company |
|---|---|---|---|
| Nava Lissette | $195,500 | None Listed On Document | |
| Sheets Gregory | $136,500 | Matc | |
| Erlenborn Deidre R | $100,000 | First American Title |
Source: Public Records
Mortgage History
| Date | Status | Borrower | Loan Amount |
|---|---|---|---|
| Open | Nava Lissette | $166,000 | |
| Previous Owner | Sheets Gregory | $129,650 | |
| Previous Owner | Erlenborn Deidre R | $96,000 |
Source: Public Records
Tax History Compared to Growth
Tax History
| Year | Tax Paid | Tax Assessment Tax Assessment Total Assessment is a certain percentage of the fair market value that is determined by local assessors to be the total taxable value of land and additions on the property. | Land | Improvement |
|---|---|---|---|---|
| 2024 | $4,092 | $52,076 | $7,375 | $44,701 |
| 2023 | $3,593 | $48,348 | $6,847 | $41,501 |
| 2022 | $3,593 | $41,752 | $5,814 | $35,938 |
| 2021 | $3,106 | $38,535 | $5,366 | $33,169 |
| 2020 | $3,002 | $37,588 | $5,234 | $32,354 |
| 2019 | $2,922 | $36,497 | $5,082 | $31,415 |
| 2018 | $2,473 | $31,643 | $5,660 | $25,983 |
| 2017 | $2,442 | $30,736 | $5,498 | $25,238 |
| 2016 | $2,353 | $29,367 | $5,253 | $24,114 |
| 2015 | $2,266 | $27,852 | $4,982 | $22,870 |
| 2014 | $2,272 | $27,146 | $4,586 | $22,560 |
| 2012 | $3,074 | $28,844 | $4,622 | $24,222 |
Source: Public Records
Map
Nearby Homes
- 5136 Cheshire Rd Unit 5136
- 5169 Pembrook Ct Unit 20A
- 1554 Deer Run Rd
- 1391 Sherwood Ct
- 35861 N Fuller Rd
- 5315 Cypress Cir
- 1999 N Fuller Rd
- 1556 Yew Ct
- 5229 Beechwood Ave
- 2105 Lawson Blvd
- 36396 N Skokie Hwy
- 1848 Princeton Ct
- 0 Tri State Pkwy
- 1896 Windsor Ct
- 5205 Notting Hill Rd
- 1795 Newport Ct
- 6091 Washington St
- 17150 Washington St
- 16655 W Applewood Ct
- 287 Kensington Ct Unit 4
- 5128 Coventry Ln Unit 8-D-1
- 5132 Coventry Ln
- 5116 Coventry Ln
- 5108 Coventry Ln
- 5120 Coventry Ln
- 5112 Coventry Ln Unit 8B1
- 5124 Coventry Ln Unit A
- 5104 Coventry Ln
- 5104 Coventry Ln Unit 8A1
- 5156 Coventry Ln Unit 9C2
- 5148 Coventry Ln Unit 9B2
- 5140 Coventry Ln Unit 9A2
- 5160 Coventry Ln Unit 9D1
- 5144 Coventry Ln Unit 9B1
- 5136 Coventry Ln Unit 9A1
- 5160 Coventry Ln Unit 5160
- 5144 Coventry Ln Unit 5144
- 5160 Coventry Ln Unit 1
- 1313 Stratford Dr Unit 10D2
- 1321 Stratford Dr Unit 10C2