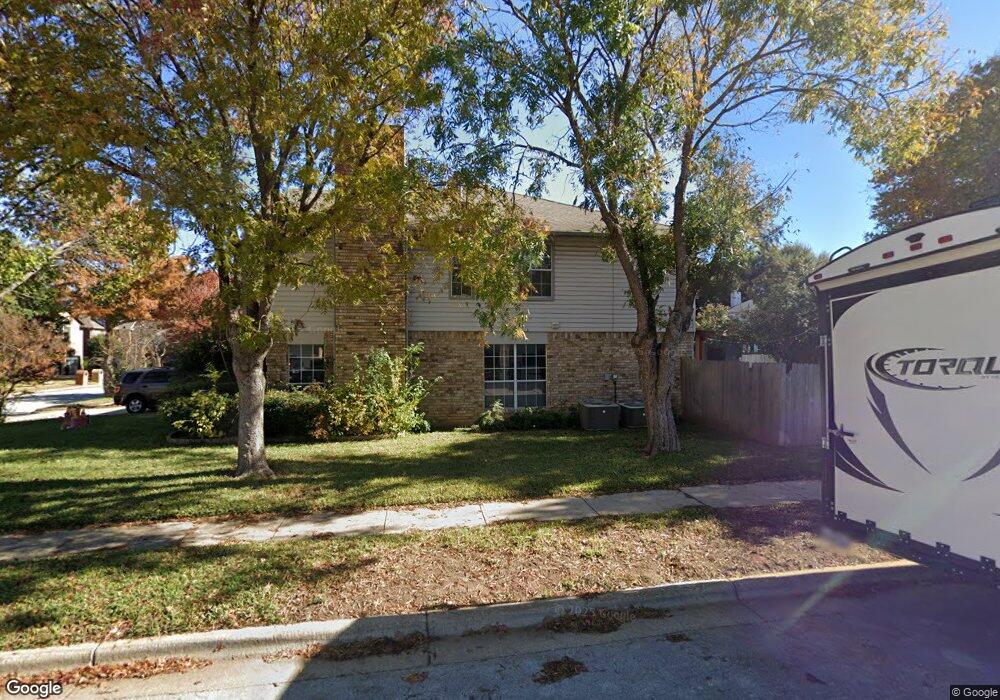
5128 Haydenbend Cir Grapevine, TX 76051
Estimated Value: $571,186 - $616,000
4
Beds
2
Baths
2,708
Sq Ft
$219/Sq Ft
Est. Value
About This Home
This home is located at 5128 Haydenbend Cir, Grapevine, TX 76051 and is currently estimated at $592,047, approximately $218 per square foot. 5128 Haydenbend Cir is a home located in Tarrant County with nearby schools including Grapevine Elementary School, Heritage Middle School, and Holy Trinity Catholic School.
Ownership History
Date
Name
Owned For
Owner Type
Purchase Details
Closed on
Apr 30, 2002
Sold by
Johnston Emily Fortner
Bought by
Johnston Jason and Johnston Emily Fortner
Current Estimated Value
Home Financials for this Owner
Home Financials are based on the most recent Mortgage that was taken out on this home.
Original Mortgage
$159,500
Outstanding Balance
$67,493
Interest Rate
6.96%
Estimated Equity
$524,554
Purchase Details
Closed on
Aug 17, 2000
Sold by
Wright Deborah Lynn
Bought by
Hazan Victor Stephen and Hazan Laura A
Home Financials for this Owner
Home Financials are based on the most recent Mortgage that was taken out on this home.
Original Mortgage
$140,000
Interest Rate
8.22%
Purchase Details
Closed on
Aug 19, 1993
Sold by
Wright Scott Cory
Bought by
Wright Deborah Lynn
Create a Home Valuation Report for This Property
The Home Valuation Report is an in-depth analysis detailing your home's value as well as a comparison with similar homes in the area
Home Values in the Area
Average Home Value in this Area
Purchase History
| Date | Buyer | Sale Price | Title Company |
|---|---|---|---|
| Johnston Jason | -- | Safeco Land Title | |
| Johnston Emily Fortner | -- | Safeco Land Title | |
| Hazan Victor Stephen | -- | Rattikin Title Co | |
| Wright Deborah Lynn | -- | -- |
Source: Public Records
Mortgage History
| Date | Status | Borrower | Loan Amount |
|---|---|---|---|
| Open | Johnston Emily Fortner | $159,500 | |
| Previous Owner | Hazan Victor Stephen | $140,000 | |
| Closed | Johnston Emily Fortner | $39,950 |
Source: Public Records
Tax History Compared to Growth
Tax History
| Year | Tax Paid | Tax Assessment Tax Assessment Total Assessment is a certain percentage of the fair market value that is determined by local assessors to be the total taxable value of land and additions on the property. | Land | Improvement |
|---|---|---|---|---|
| 2025 | $5,504 | $527,933 | $109,200 | $418,733 |
| 2024 | $5,504 | $527,933 | $109,200 | $418,733 |
| 2023 | $6,795 | $530,000 | $109,200 | $420,800 |
| 2022 | $7,301 | $420,000 | $109,200 | $310,800 |
| 2021 | $7,284 | $335,000 | $75,000 | $260,000 |
| 2020 | $7,369 | $335,000 | $75,000 | $260,000 |
| 2019 | $7,640 | $335,000 | $75,000 | $260,000 |
| 2018 | $1,981 | $333,149 | $75,000 | $258,149 |
| 2017 | $7,004 | $312,414 | $50,000 | $262,414 |
| 2016 | $6,367 | $308,141 | $50,000 | $258,141 |
| 2015 | $5,377 | $250,300 | $28,000 | $222,300 |
| 2014 | $5,377 | $250,300 | $28,000 | $222,300 |
Source: Public Records
Map
Nearby Homes
- 1803 Haydenbend Cir
- 4360 Bradford Dr
- 4336 Kenwood Dr
- 516 Briarcroft Dr
- 1917 Waterford Dr
- 2922 Hilltop Dr
- 709 Normandy Dr
- 610 Canterbury St
- 326 Park Hill Ln
- 3010 Honey Locust Dr
- 3602 Soft Wind Ct
- 3013 Peppercorn Dr
- 211 Nutmeg Ln
- 609 Knott Ct
- 2611 Jenny Ln
- 105 Clove Ln
- 3908 Heritage Oaks Dr
- 3933 Blackjack Oak Dr
- 309 Westover Dr
- 2602 Kayli Ln
- 5126 Haydenbend Cir
- 5146 Haydenbend Cir
- 5148 Haydenbend Cir
- 5137 Haydenbend Cir
- 5124 Haydenbend Cir
- 5139 Haydenbend Cir
- 5131 Haydenbend Cir
- 5129 Haydenbend Cir
- 5141 Haydenbend Cir
- 5135 Haydenbend Cir
- 5150 Haydenbend Cir
- 5127 Haydenbend Cir
- 5133 Haydenbend Cir
- 5122 Haydenbend Cir
- 5143 Haydenbend Cir
- 5125 Haydenbend Cir
- 5152 Haydenbend Cir
- 5149 Haydenbend Cir
- 5147 Haydenbend Cir
- 5151 Haydenbend Cir