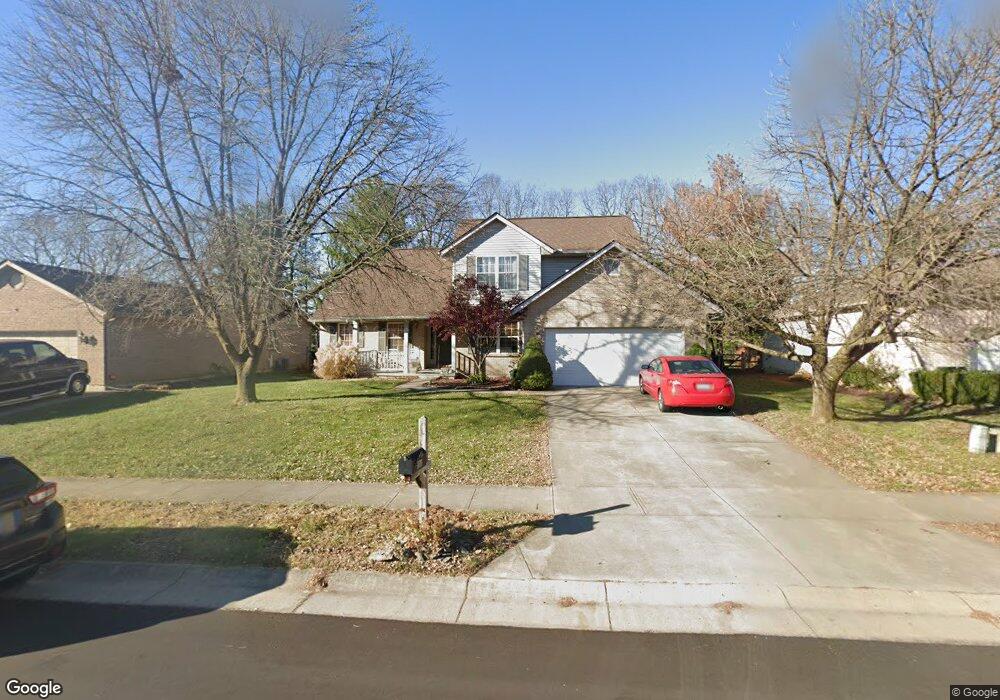
5128 Sherry Ln Fairfield, OH 45014
Estimated Value: $364,000 - $422,494
3
Beds
3
Baths
3,348
Sq Ft
$117/Sq Ft
Est. Value
About This Home
This home is located at 5128 Sherry Ln, Fairfield, OH 45014 and is currently estimated at $392,124, approximately $117 per square foot. 5128 Sherry Ln is a home located in Butler County with nearby schools including Fairfield West Elementary School, Creekside Middle School, and Fairfield Senior High School.
Ownership History
Date
Name
Owned For
Owner Type
Purchase Details
Closed on
Jan 26, 2018
Sold by
Schwab Marie E and Schwab Robert E
Bought by
Schwab Robert E
Current Estimated Value
Home Financials for this Owner
Home Financials are based on the most recent Mortgage that was taken out on this home.
Original Mortgage
$165,000
Outstanding Balance
$139,564
Interest Rate
3.94%
Mortgage Type
New Conventional
Estimated Equity
$252,560
Purchase Details
Closed on
Jul 1, 1999
Sold by
Oaktree Homes Of Butler County Inc
Bought by
Schwab Robert E and Schwab Marie E
Home Financials for this Owner
Home Financials are based on the most recent Mortgage that was taken out on this home.
Original Mortgage
$136,700
Interest Rate
7.28%
Mortgage Type
Purchase Money Mortgage
Create a Home Valuation Report for This Property
The Home Valuation Report is an in-depth analysis detailing your home's value as well as a comparison with similar homes in the area
Home Values in the Area
Average Home Value in this Area
Purchase History
| Date | Buyer | Sale Price | Title Company |
|---|---|---|---|
| Schwab Robert E | -- | None Available | |
| Schwab Robert E | $151,958 | -- |
Source: Public Records
Mortgage History
| Date | Status | Borrower | Loan Amount |
|---|---|---|---|
| Open | Schwab Robert E | $165,000 | |
| Closed | Schwab Robert E | $136,700 |
Source: Public Records
Tax History Compared to Growth
Tax History
| Year | Tax Paid | Tax Assessment Tax Assessment Total Assessment is a certain percentage of the fair market value that is determined by local assessors to be the total taxable value of land and additions on the property. | Land | Improvement |
|---|---|---|---|---|
| 2024 | $4,995 | $135,610 | $19,260 | $116,350 |
| 2023 | $4,971 | $135,610 | $19,260 | $116,350 |
| 2022 | $4,491 | $94,100 | $19,260 | $74,840 |
| 2021 | $3,885 | $92,630 | $19,260 | $73,370 |
| 2020 | $4,041 | $92,630 | $19,260 | $73,370 |
| 2019 | $4,210 | $83,400 | $18,930 | $64,470 |
| 2018 | $4,133 | $83,400 | $18,930 | $64,470 |
| 2017 | $4,174 | $83,400 | $18,930 | $64,470 |
| 2016 | $4,083 | $77,670 | $18,930 | $58,740 |
| 2015 | $3,888 | $77,670 | $18,930 | $58,740 |
| 2014 | $3,312 | $77,670 | $18,930 | $58,740 |
| 2013 | $3,312 | $69,450 | $13,520 | $55,930 |
Source: Public Records
Map
Nearby Homes
- 5120 Sherry Ln
- 4747 Circle Dr
- 5477 Southgate Blvd
- 1395 Corydale Dr
- 5428 Tallawanda Dr
- 5719 Lindenwood Ln
- 3238 Village Dr
- 1997 S Staunton Dr
- 5729 Red Oak Dr
- 5864 Emerald Lake Dr
- 5826 High Point Ct
- 691 Glenna Dr
- 5005 River Rd
- 5628 Bordeaux Way
- 2207 Rolling Hills Blvd
- 5395 Oakbrook Dr
- 5360 Burgundy Place
- 5015 Southview Dr
- 6271 River Rd
- 4300 Waterfront Ct
- 5136 Sherry Ln
- 5144 Sherry Ln
- 5112 Sherry Ln
- 5125 Sherry Ln
- 5117 Sherry Ln
- 5152 Sherry Ln
- 5100 Sherry Ln
- 5104 Sherry Ln
- 4990 Chablis Ct
- 5141 Sherry Ln
- 4889 Old Tower Ct
- 4985 Chablis Ct
- 5160 Sherry Ln
- 5096 Sherry Ln
- 4982 Chablis Ct
- 4871 Old Tower Ct
- 5088 Sherry Ln
- 5149 Sherry Ln
- 4890 Old Tower Ct
- 4977 Chablis Ct