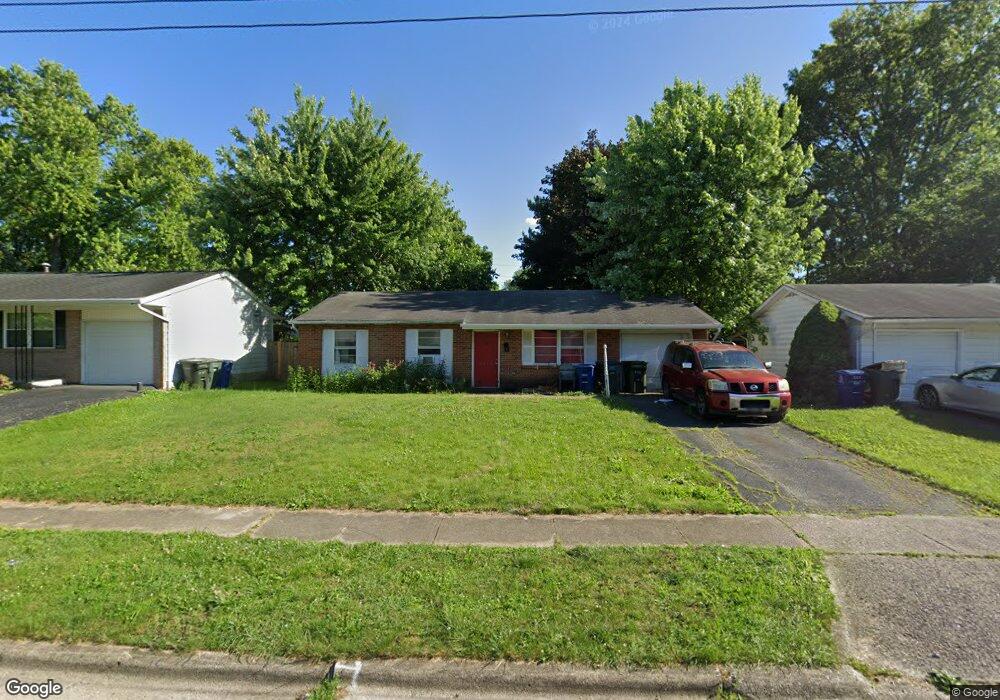
5129 Holbrook Dr Columbus, OH 43232
Walnut Heights NeighborhoodEstimated Value: $142,000 - $231,000
3
Beds
2
Baths
1,388
Sq Ft
$144/Sq Ft
Est. Value
About This Home
This home is located at 5129 Holbrook Dr, Columbus, OH 43232 and is currently estimated at $199,462, approximately $143 per square foot. 5129 Holbrook Dr is a home located in Franklin County with nearby schools including Liberty Elementary School, Yorktown Middle School, and Independence High School.
Ownership History
Date
Name
Owned For
Owner Type
Purchase Details
Closed on
Oct 4, 2017
Sold by
Ddi Oraganization Llc
Bought by
Dezalovwsky Investments Llc
Current Estimated Value
Purchase Details
Closed on
Apr 26, 2015
Sold by
Ddi Organization Llc
Bought by
Dezalovsky Investments Llc
Purchase Details
Closed on
Feb 4, 2008
Sold by
Deutsche Bank National Trust Co
Bought by
Ddi Organization Llc
Purchase Details
Closed on
Nov 2, 2007
Sold by
Layne Charles P and Case #07Cve04 4604
Bought by
Deutsche Bank National Trust Co and Hsi Asset Securitization Corp 2006-Opt4
Purchase Details
Closed on
Dec 12, 2005
Sold by
Lynch Walter K and Lynch Susann H
Bought by
Layne Charles P and Layne Heidi
Purchase Details
Closed on
Jun 1, 1993
Bought by
Lynch Walter K and Lynch Susann H
Create a Home Valuation Report for This Property
The Home Valuation Report is an in-depth analysis detailing your home's value as well as a comparison with similar homes in the area
Home Values in the Area
Average Home Value in this Area
Purchase History
| Date | Buyer | Sale Price | Title Company |
|---|---|---|---|
| Dezalovwsky Investments Llc | -- | All Ohio Title Agency Llc | |
| Dezalovsky Investments Llc | $55,000 | None Available | |
| Ddi Organization Llc | $55,000 | Accutitle Agency Inc | |
| Deutsche Bank National Trust Co | $64,000 | None Available | |
| Layne Charles P | $97,000 | Chicago Tit | |
| Lynch Walter K | -- | -- |
Source: Public Records
Tax History
| Year | Tax Paid | Tax Assessment Tax Assessment Total Assessment is a certain percentage of the fair market value that is determined by local assessors to be the total taxable value of land and additions on the property. | Land | Improvement |
|---|---|---|---|---|
| 2025 | $4,570 | $55,830 | $17,820 | $38,010 |
| 2024 | $4,570 | $55,830 | $17,820 | $38,010 |
| 2023 | $2,527 | $55,825 | $17,815 | $38,010 |
| 2022 | $2,896 | $35,040 | $6,300 | $28,740 |
| 2021 | $1,865 | $35,040 | $6,300 | $28,740 |
| 2020 | $1,868 | $35,040 | $6,300 | $28,740 |
| 2019 | $1,809 | $29,090 | $5,250 | $23,840 |
| 2018 | $1,670 | $29,090 | $5,250 | $23,840 |
| 2017 | $1,747 | $29,090 | $5,250 | $23,840 |
| 2016 | $1,686 | $24,820 | $4,340 | $20,480 |
| 2015 | $1,535 | $24,820 | $4,340 | $20,480 |
| 2014 | $1,539 | $24,820 | $4,340 | $20,480 |
| 2013 | $843 | $27,580 | $4,830 | $22,750 |
Source: Public Records
Map
Nearby Homes
- 5137 Holbrook Dr
- 2742 Denmark Rd
- 5220 Refugee Rd
- 5007 Holbrook Dr
- 4915 Kresge Dr
- 2900 Gentry Ln
- 5290 Quincy Dr
- 5114 Carbondale Dr
- 5203 Quincy Dr
- 2998 Osgood Rd E
- 5115 Jameson Dr
- 4849 Carbondale Dr
- 5392 Carbondale Dr
- 3012 Argonne Ct
- 4942 Talbert Dr
- 5083 Jameson Dr
- 2730 Raphael Dr
- 5361 Parkline Dr
- 2446 Daily Rd
- 2360 Noe Bixby Rd
- 5117 Holbrook Dr
- 5145 Holbrook Dr
- 5116 Refugee Rd
- 5108 Refugee Rd
- 5122 Refugee Rd
- 5130 Holbrook Dr
- 5101 Holbrook Dr
- 5153 Holbrook Dr
- 5100 Refugee Rd
- 5118 Holbrook Dr
- 5138 Holbrook Dr
- 5130 Refugee Rd
- 5110 Holbrook Dr
- 5146 Holbrook Dr
- 5092 Refugee Rd
- 0 Refugee Rd
- 5159 Holbrook Dr
- 5093 Holbrook Dr
- 5100 Holbrook Dr
- 5152 Holbrook Dr
Your Personal Tour Guide
Ask me questions while you tour the home.