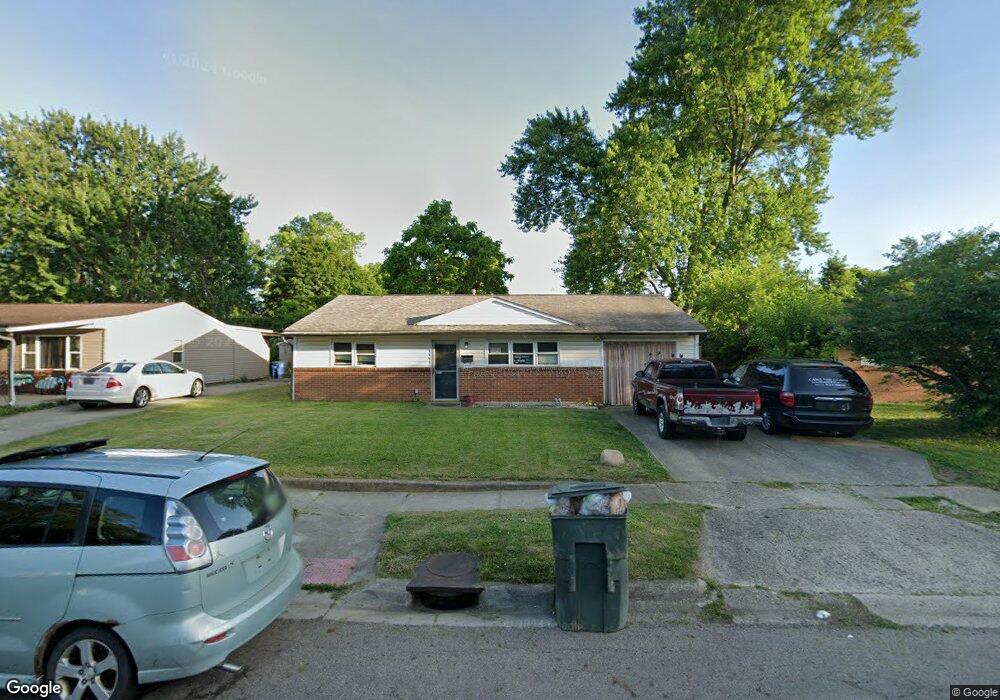
5129 Mapleridge Dr Columbus, OH 43232
Pine Hills NeighborhoodEstimated Value: $142,000 - $202,000
3
Beds
1
Bath
990
Sq Ft
$173/Sq Ft
Est. Value
About This Home
This home is located at 5129 Mapleridge Dr, Columbus, OH 43232 and is currently estimated at $171,534, approximately $173 per square foot. 5129 Mapleridge Dr is a home located in Franklin County with nearby schools including Woodcrest Elementary School, Sherwood Middle School, and Walnut Ridge High School.
Ownership History
Date
Name
Owned For
Owner Type
Purchase Details
Closed on
Nov 14, 2017
Sold by
Baldwin Dallas L
Bought by
330 Investments Llc
Current Estimated Value
Purchase Details
Closed on
Nov 6, 2017
Sold by
Adams Michelle R and Home Investment Fund Iv Lp
Bought by
330 Investments Llc
Purchase Details
Closed on
Jun 21, 2002
Sold by
Dantzler Norman R and Dantzler Raquel C
Bought by
Adams Michelle R
Home Financials for this Owner
Home Financials are based on the most recent Mortgage that was taken out on this home.
Original Mortgage
$84,333
Interest Rate
6.93%
Mortgage Type
FHA
Purchase Details
Closed on
Aug 30, 2001
Sold by
Hager Vada Mrs and Hager Vada
Bought by
Dantzler Norman R and Dantzler Raquel C
Home Financials for this Owner
Home Financials are based on the most recent Mortgage that was taken out on this home.
Original Mortgage
$78,000
Interest Rate
7.03%
Mortgage Type
VA
Purchase Details
Closed on
Jul 19, 1967
Bought by
Hager Vada Mrs
Create a Home Valuation Report for This Property
The Home Valuation Report is an in-depth analysis detailing your home's value as well as a comparison with similar homes in the area
Home Values in the Area
Average Home Value in this Area
Purchase History
| Date | Buyer | Sale Price | Title Company |
|---|---|---|---|
| 330 Investments Llc | $52,100 | None Available | |
| 330 Investments Llc | $49,307 | None Available | |
| Adams Michelle R | $85,000 | Foundation Title | |
| Dantzler Norman R | $78,000 | Foundation Title Agency Inc | |
| Hager Vada Mrs | -- | -- |
Source: Public Records
Mortgage History
| Date | Status | Borrower | Loan Amount |
|---|---|---|---|
| Previous Owner | Adams Michelle R | $84,333 | |
| Previous Owner | Dantzler Norman R | $78,000 |
Source: Public Records
Tax History
| Year | Tax Paid | Tax Assessment Tax Assessment Total Assessment is a certain percentage of the fair market value that is determined by local assessors to be the total taxable value of land and additions on the property. | Land | Improvement |
|---|---|---|---|---|
| 2025 | $1,881 | $22,930 | $12,780 | $10,150 |
| 2024 | $1,881 | $22,930 | $12,780 | $10,150 |
| 2023 | $1,828 | $40,390 | $12,775 | $27,615 |
| 2022 | $1,042 | $19,600 | $5,950 | $13,650 |
| 2021 | $1,043 | $19,600 | $5,950 | $13,650 |
| 2020 | $1,220 | $22,890 | $5,950 | $16,940 |
| 2019 | $1,139 | $18,310 | $4,760 | $13,550 |
| 2018 | $1,331 | $18,310 | $4,760 | $13,550 |
| 2017 | $1,441 | $21,910 | $4,760 | $17,150 |
| 2016 | $1,554 | $23,460 | $4,870 | $18,590 |
| 2015 | $1,411 | $23,460 | $4,870 | $18,590 |
| 2014 | $1,414 | $23,460 | $4,870 | $18,590 |
| 2013 | $774 | $26,040 | $5,390 | $20,650 |
Source: Public Records
Map
Nearby Homes
- 1945 Riverdale Rd
- 5207 Kornwal Dr
- 1905 Woodcrest Rd
- 1767 Woodcrest Rd
- 5337 Ivyhurst Dr
- 2215 Noe Bixby Rd
- 1963 Birkdale Dr
- 0 Noe Bixby Rd
- 5368 Yorkshire Village Ln Unit B23
- 5114 Carbondale Dr
- 1470 Efner Dr
- 1522 Devonhurst Dr
- 4701 Janis Dr
- 1450 Blaine Dr
- 1489 Blaine Dr
- 0 Colvin Rd
- 4589 Belfast Dr
- 4819 Calvin Dr
- 2627 Hubbell Rd
- 1639 Shady Lane Rd
- 5121 Mapleridge Dr
- 5137 Mapleridge Dr
- 5113 Mapleridge Dr
- 5145 Mapleridge Dr
- 5126 Mapleridge Dr
- 5105 Mapleridge Dr
- 5153 Mapleridge Dr
- 1960 Orlando Rd
- 1953 Orlando Rd
- 5097 Mapleridge Dr
- 5108 Mapleridge Dr
- 5161 Mapleridge Dr
- 5161 Mapleridge Dr Unit Pine Hills
- 5152 Mapleridge Dr
- 1945 Orlando Rd
- 5160 Mapleridge Dr
- 1940 Riverdale Rd
- 1948 Riverdale Rd
- 5169 Mapleridge Dr
- 1946 Orlando Rd
Your Personal Tour Guide
Ask me questions while you tour the home.