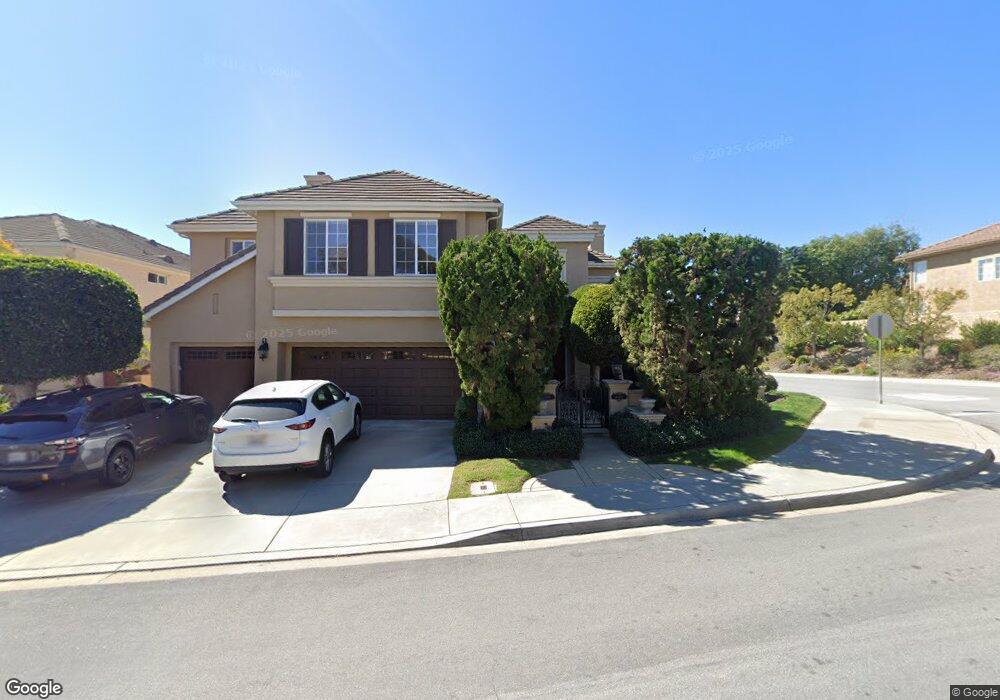
5129 Seashell Place San Diego, CA 92130
Carmel Valley NeighborhoodEstimated Value: $2,682,311 - $3,065,000
4
Beds
4
Baths
3,701
Sq Ft
$775/Sq Ft
Est. Value
About This Home
This home is located at 5129 Seashell Place, San Diego, CA 92130 and is currently estimated at $2,869,328, approximately $775 per square foot. 5129 Seashell Place is a home located in San Diego County with nearby schools including Ashley Falls Elementary School, Pacific Trails Middle, and Torrey Pines High School.
Ownership History
Date
Name
Owned For
Owner Type
Purchase Details
Closed on
Jan 12, 2011
Sold by
Irwin Michael J and Irwin Dina N
Bought by
Irwin Michael J and Irwin Dina N
Current Estimated Value
Purchase Details
Closed on
Jun 6, 2001
Sold by
Milani Amir and Milani Negin
Bought by
Irwin Michael J and Irwin Dina N
Home Financials for this Owner
Home Financials are based on the most recent Mortgage that was taken out on this home.
Original Mortgage
$855,000
Outstanding Balance
$325,686
Interest Rate
7.14%
Mortgage Type
Stand Alone First
Estimated Equity
$2,543,642
Purchase Details
Closed on
Jun 24, 1998
Sold by
Standard Pacific Corp
Bought by
Milani Amir and Milani Negin
Home Financials for this Owner
Home Financials are based on the most recent Mortgage that was taken out on this home.
Original Mortgage
$428,800
Interest Rate
6.88%
Create a Home Valuation Report for This Property
The Home Valuation Report is an in-depth analysis detailing your home's value as well as a comparison with similar homes in the area
Home Values in the Area
Average Home Value in this Area
Purchase History
| Date | Buyer | Sale Price | Title Company |
|---|---|---|---|
| Irwin Michael J | -- | None Available | |
| Irwin Michael J | $855,000 | Equity Title Company | |
| Milani Amir | $543,000 | First American Title |
Source: Public Records
Mortgage History
| Date | Status | Borrower | Loan Amount |
|---|---|---|---|
| Open | Irwin Michael J | $855,000 | |
| Previous Owner | Milani Amir | $428,800 |
Source: Public Records
Tax History Compared to Growth
Tax History
| Year | Tax Paid | Tax Assessment Tax Assessment Total Assessment is a certain percentage of the fair market value that is determined by local assessors to be the total taxable value of land and additions on the property. | Land | Improvement |
|---|---|---|---|---|
| 2025 | $15,244 | $1,335,230 | $813,691 | $521,539 |
| 2024 | $15,244 | $1,309,050 | $797,737 | $511,313 |
| 2023 | $15,099 | $1,283,384 | $782,096 | $501,288 |
| 2022 | $14,860 | $1,258,220 | $766,761 | $491,459 |
| 2021 | $14,364 | $1,233,550 | $751,727 | $481,823 |
| 2020 | $14,478 | $1,220,902 | $744,019 | $476,883 |
| 2019 | $14,220 | $1,196,964 | $729,431 | $467,533 |
| 2018 | $13,653 | $1,173,495 | $715,129 | $458,366 |
| 2017 | $13,421 | $1,150,486 | $701,107 | $449,379 |
| 2016 | $13,027 | $1,127,928 | $687,360 | $440,568 |
| 2015 | $12,852 | $1,110,987 | $677,036 | $433,951 |
| 2014 | $12,615 | $1,089,225 | $663,774 | $425,451 |
Source: Public Records
Map
Nearby Homes
- 4970 Beauchamp Ct
- 4919 Concannon Ct
- 12722 Sandy Crest Ct
- 5091 Ruette de Mer
- 13120 Chambord Way
- 5480 Valerio Trail
- 5582 Valerio Trail
- 4436 Heritage Glen Ln
- 13625 Winstanley Way
- 4271 Corte Favor
- 12436 Cavallo St
- 5621 Shasta Daisy Trail
- 5171 Del Mar Mesa Rd
- 12936 Carmel Creek Rd Unit 63
- 5312 Sweetwater Trail
- 12370 Carmel Country Rd Unit 202
- 12372 Carmel Country Rd Unit 207
- 12372 Carmel Country Rd Unit 202
- 0 Grand Del Mar Place Unit VU 8-4-5 NDP2502279
- 5146 Rancho Verde Trail
- 5143 Seashell Place
- 5124 Pearlman Way
- 5091 Seashell Place
- 5157 Seashell Place
- 5134 Pearlman Way
- 5128 Seashell Place
- 5094 Seashell Place
- 5044 Pearlman Way
- 5142 Seashell Place
- 5082 Seashell Place
- 5142 Pearlman Way
- 5171 Seashell Place
- 5081 Seashell Place
- 5156 Seashell Place
- 5036 Pearlman Way
- 5078 Seashell Place
- 5170 Seashell Place
- 5071 Seashell Place
- 5185 Seashell Place
- 5127 Pearlman Way