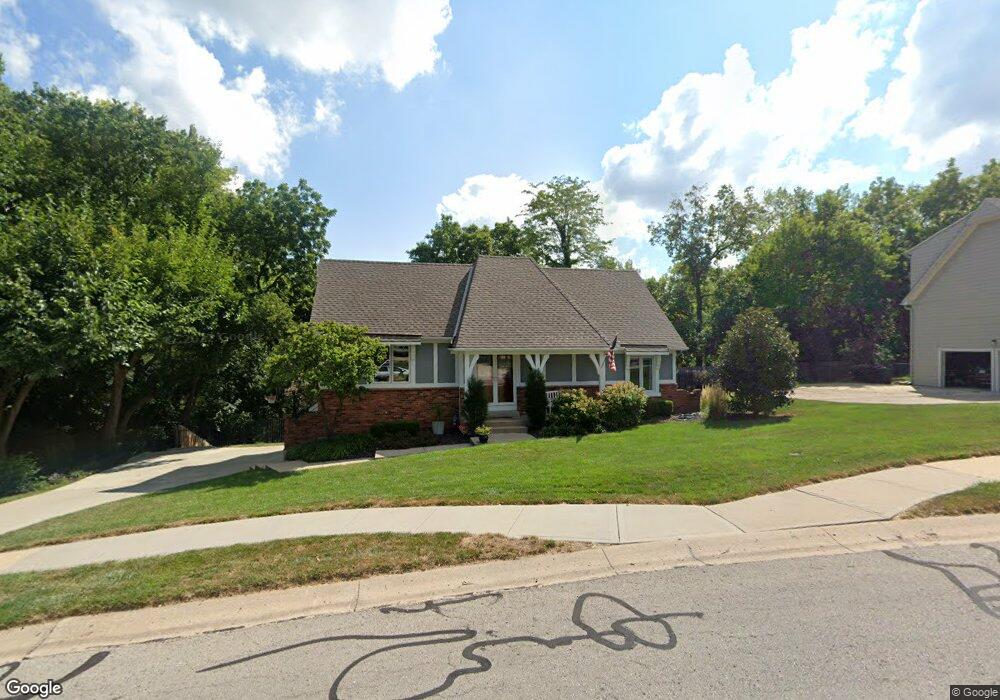
5129 Stearns St Shawnee, KS 66203
Estimated Value: $386,295 - $418,000
4
Beds
2
Baths
2,080
Sq Ft
$196/Sq Ft
Est. Value
About This Home
This home is located at 5129 Stearns St, Shawnee, KS 66203 and is currently estimated at $406,824, approximately $195 per square foot. 5129 Stearns St is a home located in Johnson County with nearby schools including Bluejacket / Flint Elementary, Hocker Grove Middle School, and Shawnee Mission North High School.
Ownership History
Date
Name
Owned For
Owner Type
Purchase Details
Closed on
Oct 31, 2022
Sold by
Dunn Eric J and Dunn Cheryl A
Bought by
Dunn Eric J and Dunn Cheryl A
Current Estimated Value
Purchase Details
Closed on
Aug 21, 2003
Sold by
Strong Vivyan E and Burquist Vivyan E
Bought by
Dunn Eric J and Dunn Cheryl A
Home Financials for this Owner
Home Financials are based on the most recent Mortgage that was taken out on this home.
Original Mortgage
$129,600
Interest Rate
3.25%
Mortgage Type
Purchase Money Mortgage
Create a Home Valuation Report for This Property
The Home Valuation Report is an in-depth analysis detailing your home's value as well as a comparison with similar homes in the area
Home Values in the Area
Average Home Value in this Area
Purchase History
| Date | Buyer | Sale Price | Title Company |
|---|---|---|---|
| Dunn Eric J | -- | None Listed On Document | |
| Dunn Cheryl A | -- | None Listed On Document | |
| Dunn Cheryl A | -- | None Listed On Document | |
| Dunn Eric J | -- | Chicago Title Ins Co |
Source: Public Records
Mortgage History
| Date | Status | Borrower | Loan Amount |
|---|---|---|---|
| Previous Owner | Dunn Eric J | $129,600 | |
| Closed | Dunn Eric J | $32,400 |
Source: Public Records
Tax History Compared to Growth
Tax History
| Year | Tax Paid | Tax Assessment Tax Assessment Total Assessment is a certain percentage of the fair market value that is determined by local assessors to be the total taxable value of land and additions on the property. | Land | Improvement |
|---|---|---|---|---|
| 2024 | $4,003 | $37,881 | $7,490 | $30,391 |
| 2023 | $4,060 | $37,870 | $6,808 | $31,062 |
| 2022 | $3,637 | $33,810 | $6,189 | $27,621 |
| 2021 | $3,661 | $31,924 | $5,380 | $26,544 |
| 2020 | $3,439 | $29,590 | $4,888 | $24,702 |
| 2019 | $3,296 | $28,336 | $4,661 | $23,675 |
| 2018 | $3,055 | $26,151 | $4,661 | $21,490 |
| 2017 | $2,921 | $24,610 | $4,232 | $20,378 |
| 2016 | $2,750 | $22,862 | $4,232 | $18,630 |
| 2015 | $2,468 | $21,333 | $4,232 | $17,101 |
| 2013 | -- | $20,114 | $4,232 | $15,882 |
Source: Public Records
Map
Nearby Homes
- 10116 W 52nd Terrace
- 9929 W 52nd St
- 10511 W 49th Place
- 0 W 49th St
- 9719 W 53rd St
- 5003 Knox Ave
- Ashwood Plan at Bristol Highlands - North
- The Fleetwood Plan at Bristol Highlands - The Villas
- Cypress II Plan at Bristol Highlands - North
- The Fleetwood Plan at Bristol Highlands - The Manors
- The Brentwood Plan at Bristol Highlands - The Villas
- Yorkshire V Plan at Bristol Highlands - North
- The Kirkwood Plan at Bristol Highlands - The Villas
- 8013 Payne St
- The Rockwood Plan at Bristol Highlands - The Villas
- Magnolia Plan at Bristol Highlands - North
- 5220 Hayes St
- 9328 W 51st St
- 5308 Mcanany Dr
- 11002 W 55th Terrace
- 5133 Stearns St
- 5125 Stearns St
- 5124 Stearns St
- 5201 Switzer Rd
- 5137 Stearns St
- 5128 Perry Ave
- 5121 Stearns St
- 5201 Switzer St
- 5132 Stearns St
- 5209 Switzer St Unit 5211
- 5136 Stearns St
- 5141 Stearns St
- 5120 Stearns St
- 5135 Perry Ave
- 5117 Stearns St
- 5120 Perry Ave
- 5213 Switzer St
- 10217 W 51st Terrace
- 5140 Stearns St
- 5215 Switzer Rd