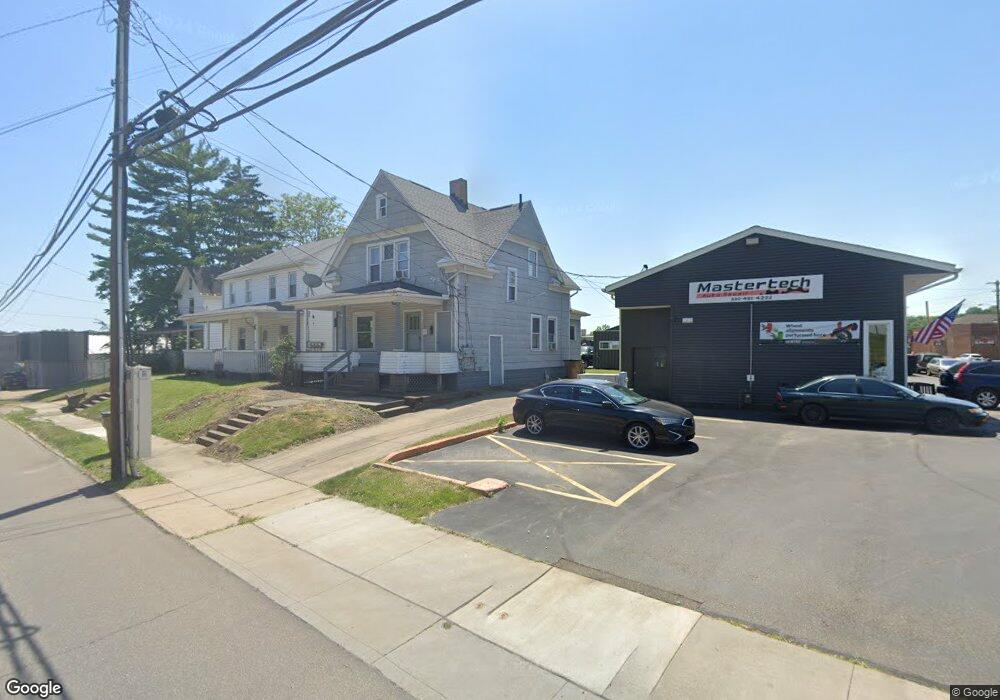
513 1st St NE Massillon, OH 44646
Downtown Massillon NeighborhoodEstimated Value: $101,000 - $116,000
2
Beds
2
Baths
1,584
Sq Ft
$69/Sq Ft
Est. Value
About This Home
This home is located at 513 1st St NE, Massillon, OH 44646 and is currently estimated at $109,938, approximately $69 per square foot. 513 1st St NE is a home located in Stark County with nearby schools including Massillon Intermediate School, Massillon Junior High School, and Washington High School.
Ownership History
Date
Name
Owned For
Owner Type
Purchase Details
Closed on
Sep 15, 2017
Sold by
Union Auto Outlet Llc
Bought by
Jd Real Estate Investments Inc
Current Estimated Value
Purchase Details
Closed on
Oct 3, 2014
Sold by
Bowman Rodney C
Bought by
Union Auto Outlet Llc
Purchase Details
Closed on
Sep 23, 2003
Sold by
First Union Home Equity Bank
Bought by
Bowman Rodney C and Bowman Wanda S
Home Financials for this Owner
Home Financials are based on the most recent Mortgage that was taken out on this home.
Original Mortgage
$27,868
Interest Rate
5.94%
Mortgage Type
Purchase Money Mortgage
Purchase Details
Closed on
May 20, 2003
Sold by
Lemon Dennis
Bought by
First Union Home Equity Bank
Purchase Details
Closed on
Apr 11, 2001
Sold by
Kingsbury Homer C
Bought by
Lemon Dennis W
Home Financials for this Owner
Home Financials are based on the most recent Mortgage that was taken out on this home.
Original Mortgage
$60,800
Interest Rate
7.05%
Mortgage Type
Purchase Money Mortgage
Create a Home Valuation Report for This Property
The Home Valuation Report is an in-depth analysis detailing your home's value as well as a comparison with similar homes in the area
Home Values in the Area
Average Home Value in this Area
Purchase History
| Date | Buyer | Sale Price | Title Company |
|---|---|---|---|
| Jd Real Estate Investments Inc | -- | None Available | |
| Union Auto Outlet Llc | $19,500 | None Available | |
| Bowman Rodney C | $30,600 | Chicago Title Ins Co | |
| First Union Home Equity Bank | $47,000 | -- | |
| Lemon Dennis W | $38,000 | Cta |
Source: Public Records
Mortgage History
| Date | Status | Borrower | Loan Amount |
|---|---|---|---|
| Previous Owner | Bowman Rodney C | $27,868 | |
| Previous Owner | Lemon Dennis W | $60,800 |
Source: Public Records
Tax History Compared to Growth
Tax History
| Year | Tax Paid | Tax Assessment Tax Assessment Total Assessment is a certain percentage of the fair market value that is determined by local assessors to be the total taxable value of land and additions on the property. | Land | Improvement |
|---|---|---|---|---|
| 2025 | -- | $28,290 | $5,850 | $22,440 |
| 2024 | -- | $28,290 | $5,850 | $22,440 |
| 2023 | $1,194 | $22,750 | $6,510 | $16,240 |
| 2022 | $1,194 | $22,750 | $6,510 | $16,240 |
| 2021 | $1,213 | $22,750 | $6,510 | $16,240 |
| 2020 | $1,061 | $18,730 | $5,360 | $13,370 |
| 2019 | $1,052 | $18,730 | $5,360 | $13,370 |
| 2018 | $1,046 | $18,730 | $5,360 | $13,370 |
| 2017 | $986 | $16,490 | $4,520 | $11,970 |
| 2016 | $1,003 | $16,490 | $4,520 | $11,970 |
| 2015 | $1,041 | $16,490 | $4,520 | $11,970 |
| 2014 | $61 | $16,280 | $4,450 | $11,830 |
| 2013 | $1,061 | $16,280 | $4,450 | $11,830 |
Source: Public Records
Map
Nearby Homes
- 313 2nd St NE
- 620 1st St NW
- 227 2nd St NE
- 611 3rd St NE
- 715 3rd St NE
- 3476 Joyce Ave NW Unit 15
- 3414 Joyce Ave NW Unit 18
- Lot 42 Joyce Ave NW
- Savannah Plan at Julian Courtyards
- Lot 31 Marys Way Ave NW
- Lot 40 Joyce Ave NW
- 433 7th St NE
- 528 Lincoln Way E
- 46 5th St SE
- 661 Cliff St NW
- 637 Wallace Ave SE
- 827 9th St NE
- 509 Tremont Ave SE
- 202 Rose Ave SE
- 834 9th St NE
- 25 Cherry Rd NE
- 509 1st St NE
- 503 1st St NE
- 424 1st St NE
- 24 Cherry Rd NE
- 30 Cherry Rd NE
- 605 1st St NE
- 428 Erie St N
- 16 Cherry Rd NE
- 420 1st St NE
- 0 Cherry Rd NW Unit 4007563
- 0 Cherry Rd NW Unit 3760906
- 0 Cherry Rd NW Unit 5040423
- 0 Cherry Rd NW Unit 4502839
- 0 Cherry Rd NW Unit 4495183
- 0 Cherry Rd NW Unit 4480189
- 0 Cherry Rd NW Unit 4462325
- 0 Cherry Rd NW Unit 4398440
- 0 Cherry Rd NW Unit 4302310
- 0 Cherry Rd NW Unit 4211317