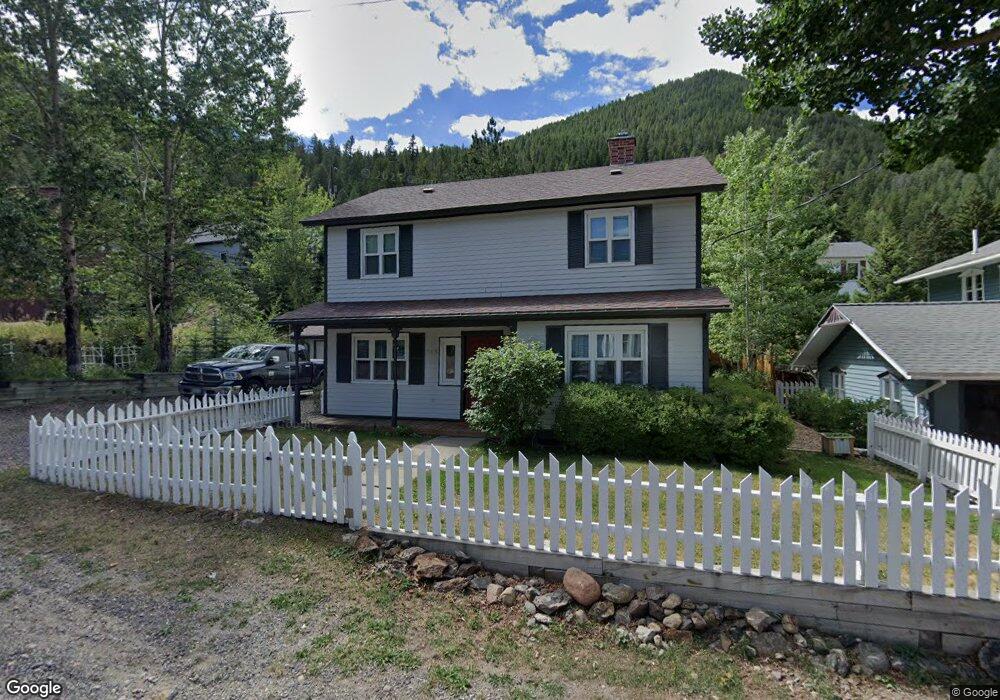
513 3rd St Georgetown, CO 80444
Estimated Value: $663,764 - $768,000
3
Beds
2
Baths
2,158
Sq Ft
$335/Sq Ft
Est. Value
About This Home
This home is located at 513 3rd St, Georgetown, CO 80444 and is currently estimated at $723,941, approximately $335 per square foot. 513 3rd St is a home with nearby schools including Clear Creek Middle School, Clear Creek High School, and Georgetown Community School.
Ownership History
Date
Name
Owned For
Owner Type
Purchase Details
Closed on
Apr 12, 2021
Sold by
Pennock James P and Pennock Kimberly B
Bought by
Pennock James Paul and Pennock Kimberly Boeckman
Current Estimated Value
Purchase Details
Closed on
Nov 21, 2006
Sold by
Gibson Andrew and Gibson Leisa
Bought by
Pennock James P and Pennock Kimberly B
Home Financials for this Owner
Home Financials are based on the most recent Mortgage that was taken out on this home.
Original Mortgage
$220,800
Outstanding Balance
$129,046
Interest Rate
6.37%
Mortgage Type
Purchase Money Mortgage
Estimated Equity
$594,895
Purchase Details
Closed on
Jul 19, 2005
Sold by
Pagano Robert and Pagano Marilynn K
Bought by
Gibson Andrew and Gibson Leisa
Home Financials for this Owner
Home Financials are based on the most recent Mortgage that was taken out on this home.
Original Mortgage
$225,600
Interest Rate
5.75%
Mortgage Type
Adjustable Rate Mortgage/ARM
Create a Home Valuation Report for This Property
The Home Valuation Report is an in-depth analysis detailing your home's value as well as a comparison with similar homes in the area
Home Values in the Area
Average Home Value in this Area
Purchase History
We collect this data history from publicly available records. To have your information removed, we recommend requesting removal directly through your county’s website.
| Date | Buyer | Sale Price | Title Company |
|---|---|---|---|
| Pennock James Paul | -- | None Available | |
| Pennock James P | $276,000 | Chicago Title Co | |
| Gibson Andrew | $282,000 | None Available |
Source: Public Records
Mortgage History
We collect this data history from publicly available records. To have your information removed, we recommend requesting removal directly through your county’s website.
| Date | Status | Borrower | Loan Amount |
|---|---|---|---|
| Open | Pennock James P | $220,800 | |
| Previous Owner | Gibson Andrew | $225,600 |
Source: Public Records
Tax History
| Year | Tax Paid | Tax Assessment Tax Assessment Total Assessment is a certain percentage of the fair market value that is determined by local assessors to be the total taxable value of land and additions on the property. | Land | Improvement |
|---|---|---|---|---|
| 2025 | $3,202 | $41,720 | $1,910 | $39,810 |
| 2024 | $2,805 | $36,120 | $1,850 | $34,270 |
| 2023 | $2,796 | $36,120 | $1,850 | $34,270 |
| 2022 | $2,581 | $33,090 | $2,120 | $30,970 |
| 2021 | $2,571 | $34,040 | $2,180 | $31,860 |
| 2020 | $1,901 | $26,380 | $2,180 | $24,200 |
| 2019 | $1,898 | $26,380 | $2,180 | $24,200 |
| 2018 | $1,527 | $22,120 | $2,200 | $19,920 |
| 2017 | $1,586 | $22,120 | $2,200 | $19,920 |
| 2016 | $1,549 | $21,600 | $1,850 | $19,750 |
| 2015 | -- | $21,600 | $1,850 | $19,750 |
| 2014 | -- | $21,290 | $3,130 | $18,160 |
Source: Public Records
Map
Nearby Homes
Your Personal Tour Guide
Ask me questions while you tour the home.