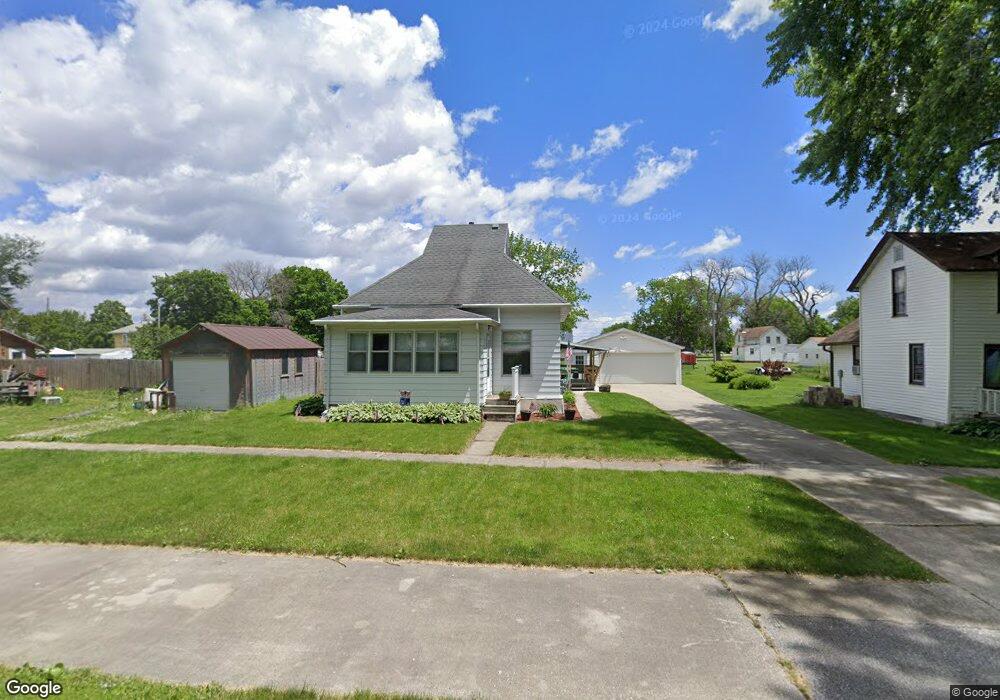
513 Allen St Duncombe, IA 50532
Estimated Value: $56,266 - $83,000
2
Beds
1
Bath
961
Sq Ft
$71/Sq Ft
Est. Value
About This Home
This home is located at 513 Allen St, Duncombe, IA 50532 and is currently estimated at $67,817, approximately $70 per square foot. 513 Allen St is a home with nearby schools including Pleasant View Elementary School, Northeast Hamilton Elementary School, and Sunset Heights Elementary School.
Ownership History
Date
Name
Owned For
Owner Type
Purchase Details
Closed on
Jan 20, 2021
Sold by
Snell Richard
Bought by
Teague Travis L
Current Estimated Value
Home Financials for this Owner
Home Financials are based on the most recent Mortgage that was taken out on this home.
Original Mortgage
$38,000
Outstanding Balance
$27,432
Interest Rate
2.1%
Mortgage Type
Balloon
Estimated Equity
$40,385
Purchase Details
Closed on
Oct 15, 2019
Sold by
Simpson Dorcas M Est
Bought by
Snell Richard D
Create a Home Valuation Report for This Property
The Home Valuation Report is an in-depth analysis detailing your home's value as well as a comparison with similar homes in the area
Home Values in the Area
Average Home Value in this Area
Purchase History
| Date | Buyer | Sale Price | Title Company |
|---|---|---|---|
| Teague Travis L | $40,000 | None Listed On Document | |
| Snell Richard D | -- | -- |
Source: Public Records
Mortgage History
| Date | Status | Borrower | Loan Amount |
|---|---|---|---|
| Open | Teague Travis L | $38,000 |
Source: Public Records
Tax History Compared to Growth
Tax History
| Year | Tax Paid | Tax Assessment Tax Assessment Total Assessment is a certain percentage of the fair market value that is determined by local assessors to be the total taxable value of land and additions on the property. | Land | Improvement |
|---|---|---|---|---|
| 2025 | $706 | $56,310 | $4,590 | $51,720 |
| 2024 | $706 | $52,720 | $4,590 | $48,130 |
| 2023 | $688 | $52,720 | $4,590 | $48,130 |
| 2022 | $670 | $46,100 | $4,590 | $41,510 |
| 2021 | $808 | $46,100 | $4,590 | $41,510 |
| 2020 | $808 | $43,350 | $4,590 | $38,760 |
| 2019 | $548 | $42,030 | $5,050 | $36,980 |
| 2018 | $588 | $38,210 | $4,590 | $33,620 |
| 2017 | $578 | $39,400 | $0 | $0 |
| 2016 | $620 | $39,400 | $0 | $0 |
| 2015 | $620 | $39,400 | $0 | $0 |
| 2014 | $620 | $39,400 | $0 | $0 |
Source: Public Records
Map
Nearby Homes