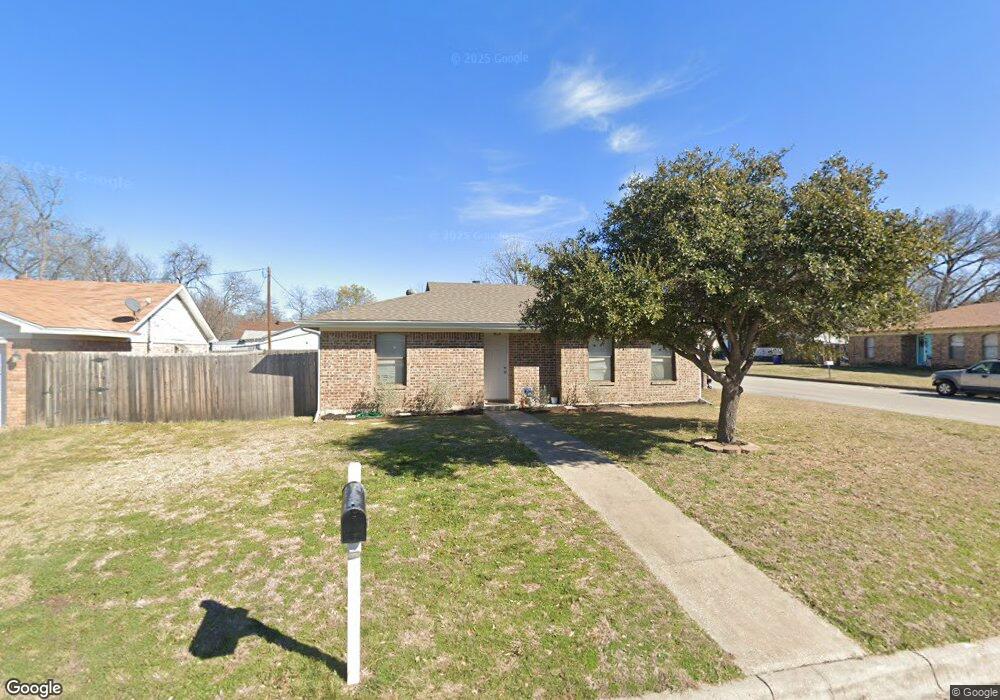
513 Allencrest Dr Fort Worth, TX 76108
Estimated Value: $230,000 - $247,000
3
Beds
2
Baths
1,329
Sq Ft
$180/Sq Ft
Est. Value
About This Home
This home is located at 513 Allencrest Dr, Fort Worth, TX 76108 and is currently estimated at $239,648, approximately $180 per square foot. 513 Allencrest Dr is a home located in Tarrant County with nearby schools including West Elementary School, Brewer Middle School, and Tannahill Intermediate School.
Ownership History
Date
Name
Owned For
Owner Type
Purchase Details
Closed on
Oct 3, 2023
Sold by
Ceramic Decorating Company Llc
Bought by
Johnson Family Enterprises Llc
Current Estimated Value
Purchase Details
Closed on
Sep 14, 2022
Sold by
Rei National Llc
Bought by
Ceramic Decorating Company Llc
Purchase Details
Closed on
Apr 25, 2022
Sold by
Gordoa Westover Andrea
Bought by
Rei Nation Llc
Purchase Details
Closed on
Sep 13, 2010
Sold by
Westover Jesse Leon
Bought by
Westover Andrea Gordoa
Purchase Details
Closed on
Feb 12, 1998
Sold by
Texas Acquisitions
Bought by
Westover Jesse Leone and Westover Andrea G
Home Financials for this Owner
Home Financials are based on the most recent Mortgage that was taken out on this home.
Original Mortgage
$64,974
Interest Rate
6.91%
Mortgage Type
VA
Create a Home Valuation Report for This Property
The Home Valuation Report is an in-depth analysis detailing your home's value as well as a comparison with similar homes in the area
Home Values in the Area
Average Home Value in this Area
Purchase History
| Date | Buyer | Sale Price | Title Company |
|---|---|---|---|
| Johnson Family Enterprises Llc | -- | None Listed On Document | |
| Ceramic Decorating Company Llc | -- | Capital Title | |
| Rei Nation Llc | -- | National Title | |
| Westover Andrea Gordoa | -- | None Available | |
| Westover Jesse Leone | -- | American Title |
Source: Public Records
Mortgage History
| Date | Status | Borrower | Loan Amount |
|---|---|---|---|
| Previous Owner | Westover Jesse Leone | $64,974 |
Source: Public Records
Tax History Compared to Growth
Tax History
| Year | Tax Paid | Tax Assessment Tax Assessment Total Assessment is a certain percentage of the fair market value that is determined by local assessors to be the total taxable value of land and additions on the property. | Land | Improvement |
|---|---|---|---|---|
| 2025 | $5,892 | $248,731 | $36,995 | $211,736 |
| 2024 | $5,892 | $248,731 | $36,995 | $211,736 |
| 2023 | $4,958 | $208,534 | $36,995 | $171,539 |
| 2022 | $3,715 | $197,922 | $25,000 | $172,922 |
| 2021 | $3,431 | $178,962 | $25,000 | $153,962 |
| 2020 | $3,142 | $168,651 | $25,000 | $143,651 |
| 2019 | $2,965 | $169,781 | $25,000 | $144,781 |
| 2018 | $2,173 | $93,702 | $12,000 | $81,702 |
| 2017 | $2,489 | $96,176 | $12,000 | $84,176 |
| 2016 | $2,263 | $104,408 | $12,000 | $92,408 |
| 2015 | $1,694 | $70,400 | $12,400 | $58,000 |
| 2014 | $1,694 | $70,400 | $12,400 | $58,000 |
Source: Public Records
Map
Nearby Homes
- 8528 Pemberton Ct
- 501 Allencrest Dr
- 428 S Las Vegas Trail
- 411 S Las Vegas Trail
- 800 Pemberton St
- 409 S Las Vegas Trail
- 407 S Las Vegas Trail
- 405 S Las Vegas Trail
- 508 Grant Cir
- 501 Pemberton St
- 8437 Redonda St
- 8508 Michael St
- 8354 Sussex St
- 8500 Wyatt Dr
- 8552 Gibbs Dr
- 8400 Wyatt Dr
- 9100 Rowland Dr
- 809 Mirike Dr
- 1725 S Las Vegas Trail
- 8402 Melrose St W
- 509 Allencrest Dr
- 8536 Pemberton Ct
- 8541 Pemberton Ct
- 505 Allencrest Dr
- 8532 Pemberton Ct
- 512 Allencrest Dr
- 516 Allencrest Dr
- 521 Allencrest Dr
- 508 Allencrest Dr
- 8537 Sussex Ct
- 8537 Pemberton Ct
- 520 Allencrest Dr
- 504 Allencrest Dr
- 8533 Pemberton Ct
- 8533 Sussex Ct
- 8548 Whitney Dr
- 524 Allencrest Dr
- 8524 Pemberton Ct
- 8529 Sussex Ct
- 500 Allencrest Dr