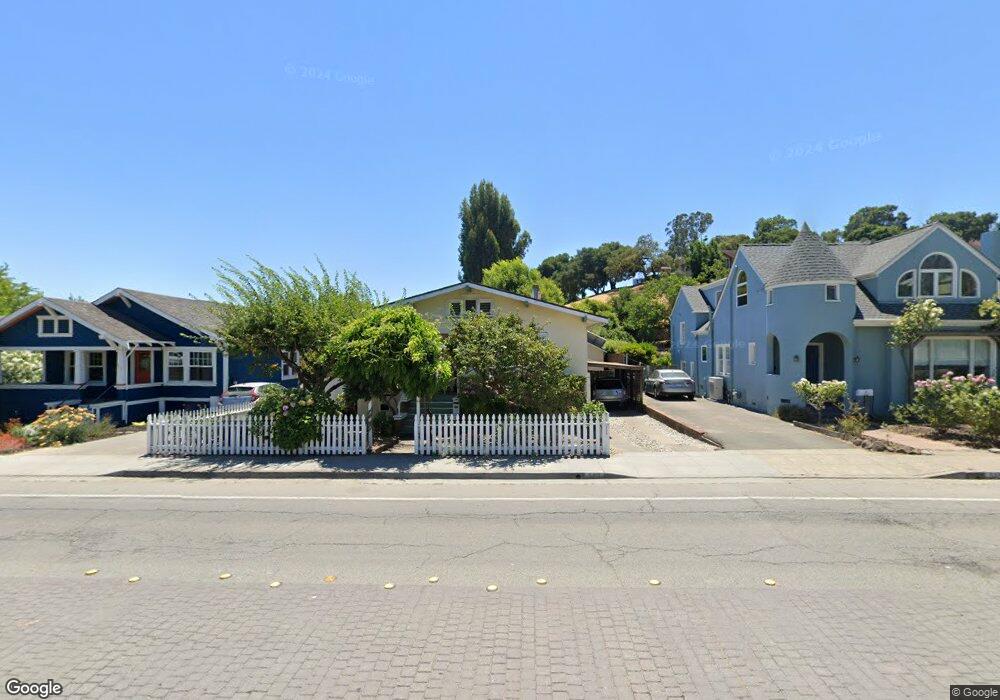
513 Bodega Ave Petaluma, CA 94952
Western Petaluma NeighborhoodEstimated Value: $824,000 - $991,000
3
Beds
2
Baths
1,520
Sq Ft
$592/Sq Ft
Est. Value
About This Home
This home is located at 513 Bodega Ave, Petaluma, CA 94952 and is currently estimated at $900,353, approximately $592 per square foot. 513 Bodega Ave is a home located in Sonoma County with nearby schools including Valley Vista Elementary School, Petaluma Junior High School, and Petaluma High School.
Ownership History
Date
Name
Owned For
Owner Type
Purchase Details
Closed on
Sep 9, 2013
Sold by
Hollibaugh William L and Hollibaugh Gemma A
Bought by
Hollibaugh William L and Hollibaugh Gemma A
Current Estimated Value
Home Financials for this Owner
Home Financials are based on the most recent Mortgage that was taken out on this home.
Original Mortgage
$100,000
Interest Rate
4.36%
Mortgage Type
Credit Line Revolving
Purchase Details
Closed on
Apr 13, 2000
Sold by
Hollibaugh William L and Hollibaugh Gemma A
Bought by
Hollibaugh William L and Hollibaugh Gemma A
Create a Home Valuation Report for This Property
The Home Valuation Report is an in-depth analysis detailing your home's value as well as a comparison with similar homes in the area
Home Values in the Area
Average Home Value in this Area
Purchase History
| Date | Buyer | Sale Price | Title Company |
|---|---|---|---|
| Hollibaugh William L | -- | North Coast Title Co | |
| Hollibaugh William L | -- | -- |
Source: Public Records
Mortgage History
| Date | Status | Borrower | Loan Amount |
|---|---|---|---|
| Closed | Hollibaugh William L | $100,000 |
Source: Public Records
Tax History
| Year | Tax Paid | Tax Assessment Tax Assessment Total Assessment is a certain percentage of the fair market value that is determined by local assessors to be the total taxable value of land and additions on the property. | Land | Improvement |
|---|---|---|---|---|
| 2025 | $1,218 | $120,875 | $23,545 | $97,330 |
| 2024 | $1,218 | $118,506 | $23,084 | $95,422 |
| 2023 | $1,218 | $116,183 | $22,632 | $93,551 |
| 2022 | $1,191 | $113,906 | $22,189 | $91,717 |
| 2021 | $1,167 | $111,673 | $21,754 | $89,919 |
| 2020 | $1,176 | $110,528 | $21,531 | $88,997 |
| 2019 | $1,160 | $108,361 | $21,109 | $87,252 |
| 2018 | $1,154 | $106,238 | $20,696 | $85,542 |
| 2017 | $1,129 | $104,156 | $20,291 | $83,865 |
| 2016 | $1,091 | $102,115 | $19,894 | $82,221 |
| 2015 | $1,074 | $100,582 | $19,596 | $80,986 |
| 2014 | $1,067 | $98,613 | $19,213 | $79,400 |
Source: Public Records
Map
Nearby Homes
- 13 Dorenfeld Ct
- 12 Dorenfeld Ct
- 809 Gilardi Dr
- 852 Western Ave
- 712 Oak Terrace
- 513 Larch Dr
- 509 Larch Dr
- 510 Kent St
- 518 Galland St
- 136 Court St
- 301 Broadway St
- 331 Keller St Unit 6
- 131 Liberty St
- 24 La Cresta Dr
- 512 Kentucky St
- 100 Orchard Ln
- 743 Paula Ln
- 142 Cherry St
- 65 Freedom Ln N
- 1104 Birch Dr
Your Personal Tour Guide
Ask me questions while you tour the home.