Estimated Value: $342,935 - $379,000
Studio
--
Bath
2,074
Sq Ft
$177/Sq Ft
Est. Value
About This Home
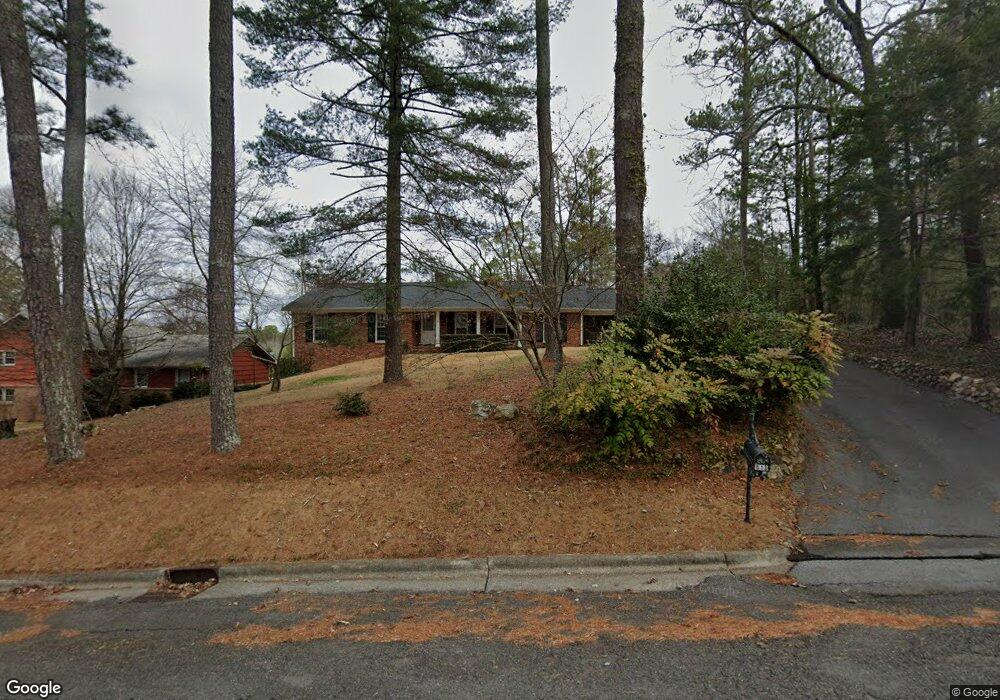
This home is located at 513 E 11th St SE, Rome, GA 30161 and is currently estimated at $367,734, approximately $177 per square foot. 513 E 11th St SE is a home located in Floyd County with nearby schools including Rome High School, St. Mary School, and Darlington School.
Ownership History
Date
Name
Owned For
Owner Type
Purchase Details
Closed on
Mar 12, 2014
Sold by
Cooper John Paul
Bought by
Cooper John Paul
Current Estimated Value
Purchase Details
Closed on
Sep 1, 1981
Sold by
Cooper Mark A
Bought by
Cooper Jane R
Purchase Details
Closed on
Sep 9, 1968
Sold by
Brester Edward W
Bought by
Cooper Mark A
Purchase Details
Closed on
May 1, 1959
Bought by
Brester Edward W
Create a Home Valuation Report for This Property
The Home Valuation Report is an in-depth analysis detailing your home's value as well as a comparison with similar homes in the area
Home Values in the Area
Average Home Value in this Area
Purchase History
| Date | Buyer | Sale Price | Title Company |
|---|---|---|---|
| Cooper John Paul | -- | -- | |
| Cooper Jane R | -- | -- | |
| Cooper Mark A | $33,000 | -- | |
| Brester Edward W | -- | -- |
Source: Public Records
Tax History
| Year | Tax Paid | Tax Assessment Tax Assessment Total Assessment is a certain percentage of the fair market value that is determined by local assessors to be the total taxable value of land and additions on the property. | Land | Improvement |
|---|---|---|---|---|
| 2025 | $3,728 | $153,216 | $20,522 | $132,694 |
| 2024 | $3,688 | $143,590 | $18,656 | $124,934 |
| 2023 | $2,862 | $133,318 | $16,960 | $116,358 |
| 2022 | $3,299 | $115,150 | $13,992 | $101,158 |
| 2021 | $2,644 | $86,718 | $13,992 | $72,726 |
| 2020 | $2,558 | $80,778 | $10,600 | $70,178 |
| 2019 | $2,488 | $78,041 | $10,600 | $67,441 |
| 2018 | $2,439 | $75,220 | $10,600 | $64,620 |
| 2017 | $2,255 | $64,671 | $10,600 | $54,071 |
| 2016 | $2,248 | $63,880 | $10,600 | $53,280 |
| 2015 | $2,108 | $60,000 | $10,600 | $49,400 |
| 2014 | $2,108 | $61,890 | $10,600 | $51,290 |
Source: Public Records
Map
Nearby Homes
- 153 Vinings Ct SE
- 20 Riverview Rd SE
- 7 Crestview Ln SE
- 9 Richland Ct SE
- 23 Gables Dr SE
- 811 Collinwood Rd SE
- 1 Vassar Dr SE
- 0 Turnbull Dr SE Unit 10570009
- 12 Turnbull Dr SE
- 4 Townview Rd SE
- 307 E 11th St SE
- 2606 Callier Springs Rd SE
- 416 E 9th St SE
- 415 E 10th St SE
- 1407 E 2nd Ave SE
- 1312 E 2nd Ave SE
- 1314 E 2nd Ave SE
- 115 E Boundary St SE
- 117 E Boundary St SE
- 209 Moultrie Ln SE
- 511 E 11th St SE
- 517 E 11th St SE
- 1 Overhill Rd SE
- 509 E 11th St SE
- 115 Vinings Ct SE
- 512 E 11th St SE
- 508 E 11th St SE
- 138 Vinings Ct SE
- 519 E 11th St SE
- 507 E 11th St SE
- 506 E 11th St SE
- 114 Vinings Ct SE
- 139 Vinings Ct SE
- 3 Overhill Rd SE
- 516 E 11th St SE
- 521 E 11th St SE
- 505 E 11th St SE Unit 7
- 505 E 11th St SE
- 113 Vinings Dr SE
- 140 Vinings Ct SE
Your Personal Tour Guide
Ask me questions while you tour the home.