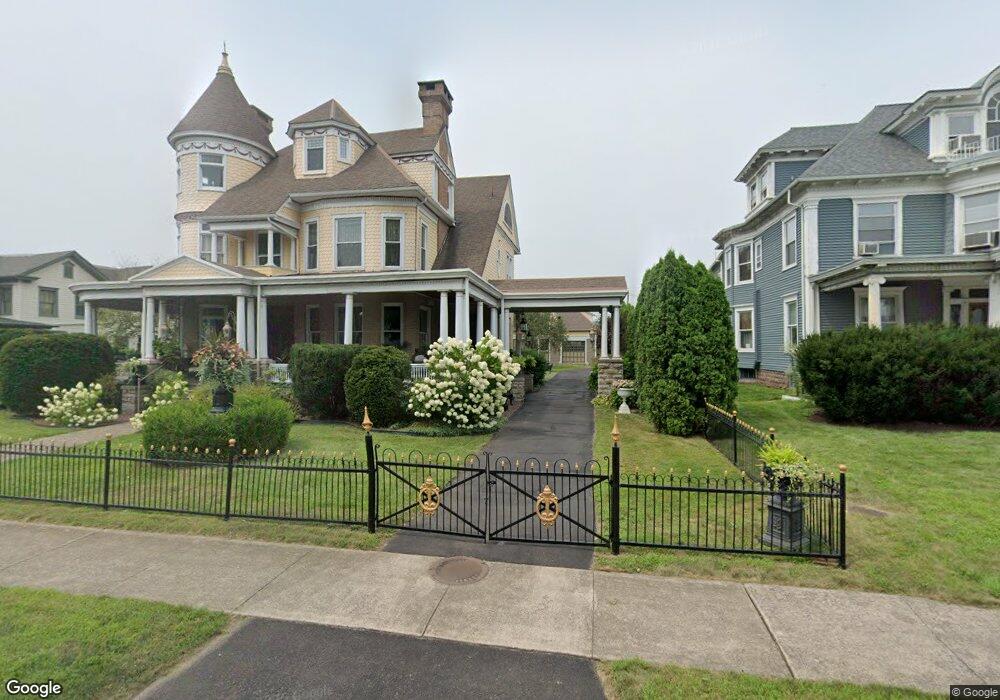
513 E 2nd St Berwick, PA 18603
Estimated Value: $205,842 - $298,000
3
Beds
2
Baths
1,820
Sq Ft
$129/Sq Ft
Est. Value
About This Home
This home is located at 513 E 2nd St, Berwick, PA 18603 and is currently estimated at $235,211, approximately $129 per square foot. 513 E 2nd St is a home located in Luzerne County with nearby schools including Berwick Area High School, Holy Family Consolidated School, and New Story School.
Ownership History
Date
Name
Owned For
Owner Type
Purchase Details
Closed on
May 19, 2014
Sold by
Nespoli Marc C and Nespoli Kathryn M
Bought by
Naunczek Lisa
Current Estimated Value
Home Financials for this Owner
Home Financials are based on the most recent Mortgage that was taken out on this home.
Original Mortgage
$127,546
Outstanding Balance
$95,520
Interest Rate
4.26%
Mortgage Type
FHA
Estimated Equity
$139,691
Purchase Details
Closed on
Sep 25, 2012
Sold by
Mormando Toni
Bought by
Wells Fargo Bank Na
Purchase Details
Closed on
Apr 8, 2006
Sold by
Cashman Neil J and Cashman Kathleen L
Bought by
Mormando Toni
Home Financials for this Owner
Home Financials are based on the most recent Mortgage that was taken out on this home.
Original Mortgage
$72,000
Interest Rate
10.44%
Mortgage Type
Assumption
Create a Home Valuation Report for This Property
The Home Valuation Report is an in-depth analysis detailing your home's value as well as a comparison with similar homes in the area
Home Values in the Area
Average Home Value in this Area
Purchase History
| Date | Buyer | Sale Price | Title Company |
|---|---|---|---|
| Naunczek Lisa | $129,900 | None Available | |
| Wells Fargo Bank Na | $1,160 | None Available | |
| Mormando Toni | $90,000 | None Available |
Source: Public Records
Mortgage History
| Date | Status | Borrower | Loan Amount |
|---|---|---|---|
| Open | Naunczek Lisa | $127,546 | |
| Previous Owner | Mormando Toni | $72,000 |
Source: Public Records
Tax History
| Year | Tax Paid | Tax Assessment Tax Assessment Total Assessment is a certain percentage of the fair market value that is determined by local assessors to be the total taxable value of land and additions on the property. | Land | Improvement |
|---|---|---|---|---|
| 2026 | $2,354 | $103,100 | $35,400 | $67,700 |
| 2025 | $2,322 | $103,100 | $35,400 | $67,700 |
| 2024 | $2,252 | $103,100 | $35,400 | $67,700 |
| 2023 | $2,162 | $103,100 | $35,400 | $67,700 |
| 2022 | $2,143 | $103,100 | $35,400 | $67,700 |
| 2021 | $2,143 | $103,100 | $35,400 | $67,700 |
| 2020 | $1,852 | $103,100 | $35,400 | $67,700 |
| 2019 | $1,838 | $103,100 | $35,400 | $67,700 |
| 2018 | $1,824 | $103,100 | $35,400 | $67,700 |
| 2017 | $1,908 | $103,100 | $35,400 | $67,700 |
| 2016 | -- | $103,100 | $35,400 | $67,700 |
| 2015 | $1,473 | $103,100 | $35,400 | $67,700 |
| 2014 | $1,473 | $103,100 | $35,400 | $67,700 |
Source: Public Records
Map
Nearby Homes
- 539 E 2nd St
- 233 E 3rd St
- 217 E 3rd St
- 229 E 5th St
- 208 Pine St
- 609 E 8th St
- 114 E 7th St
- 204 206 E 10 St
- 1006 Pine St
- LOT 11,320 E 13th St
- 1000 E 6th St
- 0 Pennsylvania 93
- 1031 E Front St
- LOT 5, 320 E 13th St
- 911 N Mulberry St
- 1308 Chestnut St
- 341 N Vine St
- 710 E 2nd St
- 1333 7th Ave
- 1201 N Market St
Your Personal Tour Guide
Ask me questions while you tour the home.