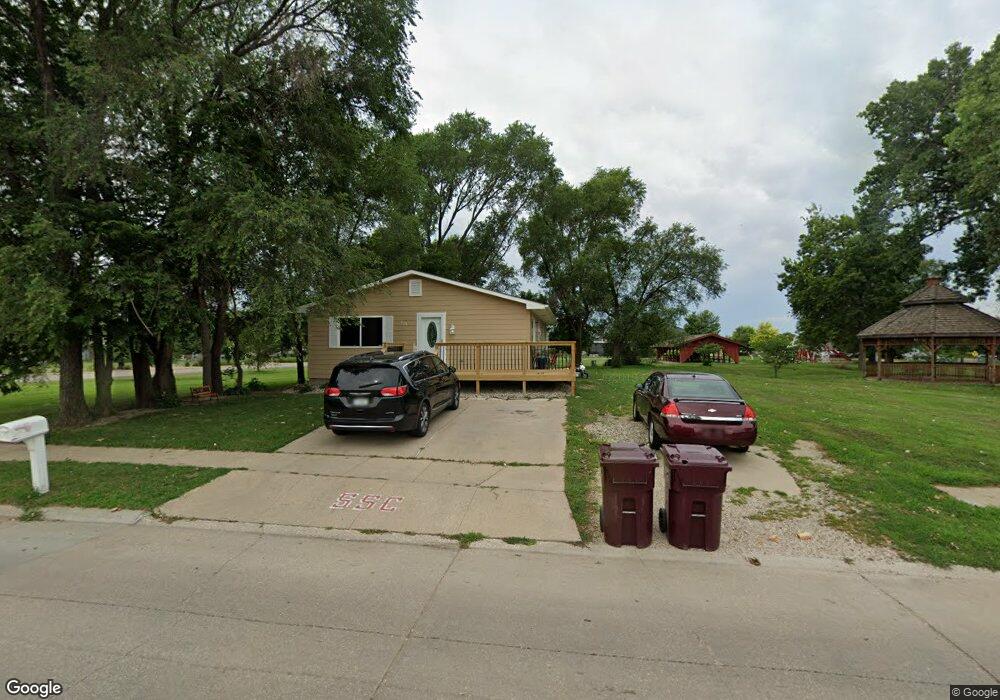
513 E St South Sioux City, NE 68776
Estimated Value: $189,000 - $258,000
3
Beds
1
Bath
1,008
Sq Ft
$217/Sq Ft
Est. Value
About This Home
This home is located at 513 E St, South Sioux City, NE 68776 and is currently estimated at $218,457, approximately $216 per square foot. 513 E St is a home located in Dakota County with nearby schools including Harney Elementary School, South Sioux City Middle School, and South Sioux Senior High School.
Ownership History
Date
Name
Owned For
Owner Type
Purchase Details
Closed on
Nov 26, 2014
Sold by
Deleon Oscar R and Deleon Ma Rebeca
Bought by
Deleon Miguel and Deleon Maria G
Current Estimated Value
Home Financials for this Owner
Home Financials are based on the most recent Mortgage that was taken out on this home.
Original Mortgage
$90,333
Outstanding Balance
$70,325
Interest Rate
4.37%
Mortgage Type
FHA
Estimated Equity
$148,132
Purchase Details
Closed on
Jun 17, 2005
Sold by
Sejv 2003 1 Llc
Bought by
Deleon Oscar R and Deleon Ma Rebeca
Home Financials for this Owner
Home Financials are based on the most recent Mortgage that was taken out on this home.
Original Mortgage
$54,080
Interest Rate
5.76%
Mortgage Type
New Conventional
Purchase Details
Closed on
Sep 9, 2004
Sold by
Mc Cash Suc Trustee Douglas E
Bought by
Sfjv-2003-1
Purchase Details
Closed on
Aug 23, 2001
Sold by
Hernandez Emilio and Hernandez Minerva
Bought by
Mccauley Sheila D
Purchase Details
Closed on
Feb 22, 1999
Sold by
Bobieir Ronnie D and Bobieir Robin L
Bought by
Hernandez Emilio and Hernandez Minerva
Create a Home Valuation Report for This Property
The Home Valuation Report is an in-depth analysis detailing your home's value as well as a comparison with similar homes in the area
Home Values in the Area
Average Home Value in this Area
Purchase History
| Date | Buyer | Sale Price | Title Company |
|---|---|---|---|
| Deleon Miguel | -- | Nationwide Title Clearing | |
| Deleon Oscar R | $52,888 | -- | |
| Sfjv-2003-1 | $86,200 | -- | |
| Mccauley Sheila D | $81,000 | -- | |
| Hernandez Emilio | $71,000 | -- |
Source: Public Records
Mortgage History
| Date | Status | Borrower | Loan Amount |
|---|---|---|---|
| Open | Deleon Miguel | $90,333 | |
| Previous Owner | Deleon Oscar R | $54,080 |
Source: Public Records
Tax History Compared to Growth
Tax History
| Year | Tax Paid | Tax Assessment Tax Assessment Total Assessment is a certain percentage of the fair market value that is determined by local assessors to be the total taxable value of land and additions on the property. | Land | Improvement |
|---|---|---|---|---|
| 2024 | $2,157 | $165,420 | $10,800 | $154,620 |
| 2023 | $2,642 | $148,780 | $6,480 | $142,300 |
| 2022 | $2,697 | $141,040 | $6,480 | $134,560 |
| 2021 | $2,333 | $117,730 | $6,480 | $111,250 |
| 2020 | $2,354 | $117,730 | $6,480 | $111,250 |
| 2019 | $2,341 | $116,775 | $6,480 | $110,295 |
| 2018 | $2,281 | $112,820 | $6,480 | $106,340 |
| 2017 | $2,175 | $107,850 | $6,480 | $101,370 |
| 2016 | $2,040 | $102,905 | $6,480 | $96,425 |
| 2014 | $1,894 | $92,010 | $6,800 | $85,210 |
Source: Public Records
Map
Nearby Homes
- 101 E 4th St Unit 8
- 1018 & 1018 1/2 B St
- 429 E 15th St
- 423 W 3rd St
- 700 4th St Unit 604
- 314 E 17th St
- 1840 Ogden Ct
- 1700 Ogden Ct
- 1401 & 1402 5th Ave
- 1717 Sampson Ln
- 405 W 17th St
- 426 W 1st St
- 502 W 1st St
- 2101 F St
- 208 Sioux St
- 1906 Leech Ave
- 914 Jackson St
- 202 E 23rd St
- 1003 Pierce St
- 405-7 Cook St