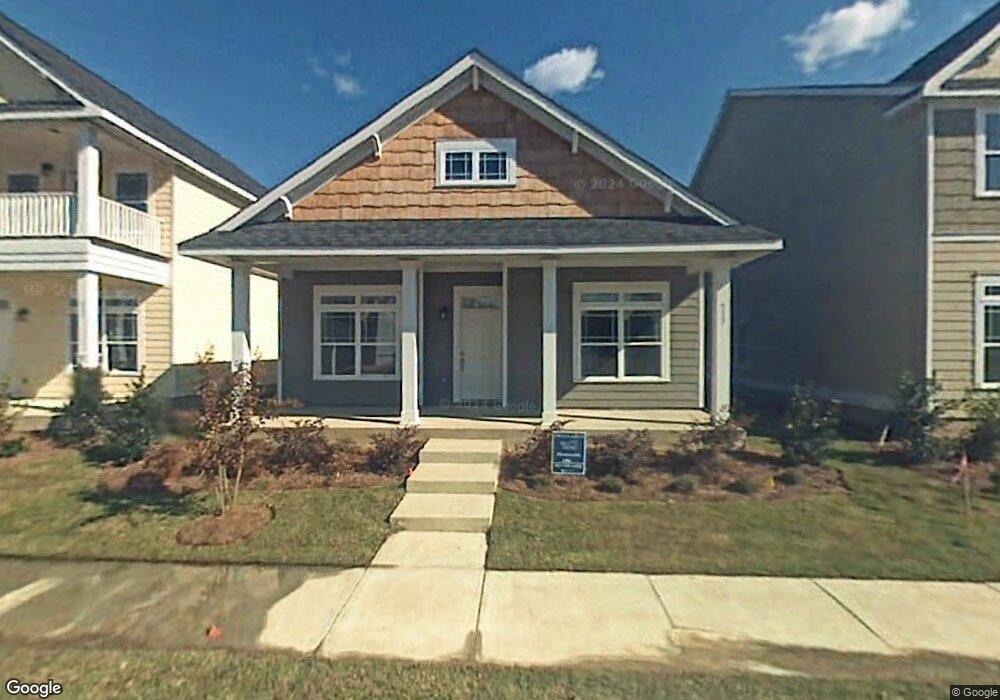
513 Flat Rock Trace Savannah, GA 31407
Estimated Value: $248,007 - $296,000
3
Beds
2
Baths
1,337
Sq Ft
$205/Sq Ft
Est. Value
About This Home
This home is located at 513 Flat Rock Trace, Savannah, GA 31407 and is currently estimated at $274,252, approximately $205 per square foot. 513 Flat Rock Trace is a home located in Chatham County with nearby schools including Rice Creek K-8 School and Groves High School.
Ownership History
Date
Name
Owned For
Owner Type
Purchase Details
Closed on
Feb 5, 2019
Sold by
Bush Ashley
Bought by
Savannah Real Estate Management Llc
Current Estimated Value
Purchase Details
Closed on
Dec 22, 2015
Sold by
Parker Sarah
Bought by
Bush Ashley Carson
Home Financials for this Owner
Home Financials are based on the most recent Mortgage that was taken out on this home.
Original Mortgage
$147,184
Interest Rate
4.4%
Mortgage Type
FHA
Purchase Details
Closed on
Jun 30, 2014
Sold by
Zeigler Frederick M
Bought by
Parker Sarah
Purchase Details
Closed on
Sep 17, 2012
Sold by
Albrecht Stephen E
Bought by
Zeigler Frederick M and Parker Sarah
Home Financials for this Owner
Home Financials are based on the most recent Mortgage that was taken out on this home.
Original Mortgage
$137,653
Interest Rate
3.68%
Mortgage Type
New Conventional
Purchase Details
Closed on
Dec 15, 2011
Bought by
Albrecht Stephen E
Purchase Details
Closed on
Oct 25, 2006
Bought by
Sivica Homes & Sivica Homes and - Rice Hope Llc 1640 Powers Fe
Create a Home Valuation Report for This Property
The Home Valuation Report is an in-depth analysis detailing your home's value as well as a comparison with similar homes in the area
Home Values in the Area
Average Home Value in this Area
Purchase History
| Date | Buyer | Sale Price | Title Company |
|---|---|---|---|
| Savannah Real Estate Management Llc | $112,806 | -- | |
| Bush Ashley Carson | $149,900 | -- | |
| Parker Sarah | -- | -- | |
| Zeigler Frederick M | $134,900 | -- | |
| Albrecht Stephen E | $47,000 | -- | |
| Albrecht Stephen E | $47,000 | -- | |
| Sivica Homes & Sivica Homes | $1,035,000 | -- |
Source: Public Records
Mortgage History
| Date | Status | Borrower | Loan Amount |
|---|---|---|---|
| Previous Owner | Bush Ashley Carson | $147,184 | |
| Previous Owner | Zeigler Frederick M | $137,653 |
Source: Public Records
Tax History Compared to Growth
Tax History
| Year | Tax Paid | Tax Assessment Tax Assessment Total Assessment is a certain percentage of the fair market value that is determined by local assessors to be the total taxable value of land and additions on the property. | Land | Improvement |
|---|---|---|---|---|
| 2025 | $2,548 | $45,122 | $12,000 | $33,122 |
| 2024 | $2,548 | $45,122 | $12,000 | $33,122 |
| 2023 | $2,187 | $45,122 | $12,000 | $33,122 |
| 2022 | $1,527 | $45,122 | $12,000 | $33,122 |
| 2021 | $2,061 | $45,122 | $12,000 | $33,122 |
| 2020 | $1,735 | $58,840 | $14,000 | $44,840 |
| 2019 | $2,577 | $59,040 | $12,000 | $47,040 |
| 2018 | $1,570 | $53,200 | $8,000 | $45,200 |
| 2017 | $1,560 | $53,520 | $8,000 | $45,520 |
| 2016 | $1,560 | $52,880 | $8,000 | $44,880 |
| 2015 | $1,753 | $53,440 | $8,000 | $45,440 |
| 2014 | $2,273 | $47,200 | $0 | $0 |
Source: Public Records
Map
Nearby Homes
- 135 Moonlight Trail
- 133 Moonlight Trail
- 110 Moonlight Trail
- 121 Moonlight Trail
- 209 Cold Creek Loop
- 107 Moonlight Trail
- 102 Cold Creek Pass
- 423 Flat Rock Trace
- 20 Mossy Oak Cove
- 339 Cold Creek Pass
- 23 Mossy Oak Cove
- 215 Lakeside Dr
- 3 Hawkins Pass
- 43 Hawkins Pass
- 31 Hawkins Pass
- 41 Hawkins Pass
- 37 Hawkins Pass
- 513 Flat Rock Trace
- 515 Flat Rock Trace
- 515 Flat Rock Trace
- 511 Flat Rock Trace
- 511 Flat Rock Trace
- 515 Flat Rock Terrace
- 509 Flat Rock Trace
- 517 Flat Rock Trace
- 517 Flat Rock Trace
- 509 Flat Rock Trace
- 10 Sandy Shoals Pass
- 8 Sandy Shoals Pass Unit 170
- 8 Sandy Shoals Pass
- 12 Sandy Shoals Pass
- 10 Sandy Shoals Pass
- 519 Flat Rock Trace
- 519 Flat Rock Trace
- 507 Flat Rock Trace
- 507 Flat Rock Trace
- 12 Sandy Shoals Pass