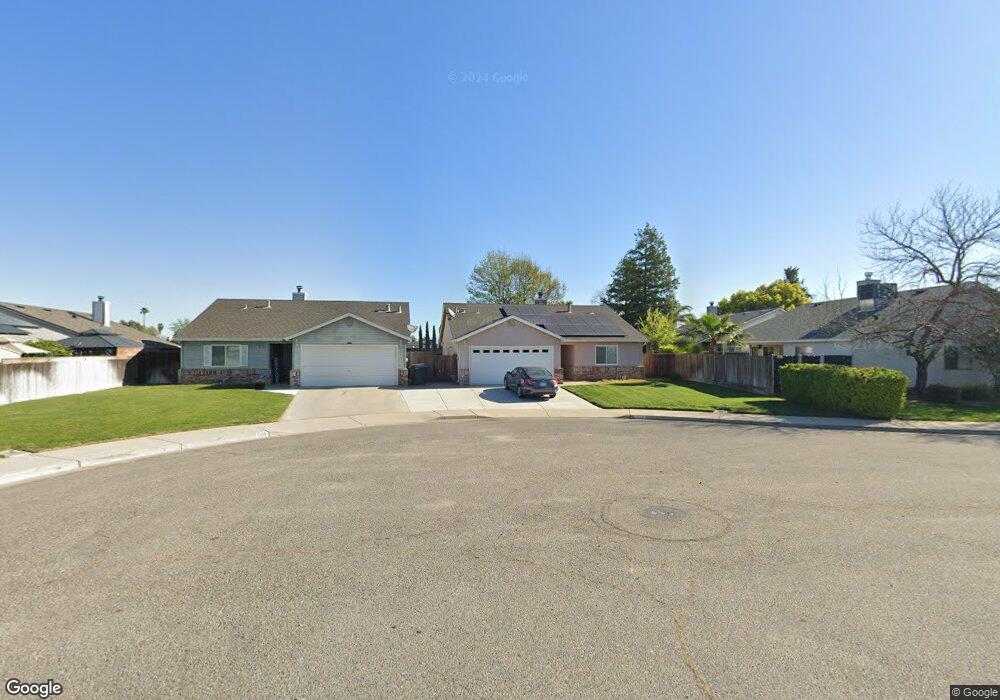
513 Jackson Ct Chowchilla, CA 93610
Estimated Value: $297,931 - $397,000
3
Beds
2
Baths
1,184
Sq Ft
$283/Sq Ft
Est. Value
About This Home
This home is located at 513 Jackson Ct, Chowchilla, CA 93610 and is currently estimated at $334,483, approximately $282 per square foot. 513 Jackson Ct is a home located in Madera County with nearby schools including Merle L. Fuller Elementary School, Stephens Elementary School, and Ronald Reagan Elementary School.
Ownership History
Date
Name
Owned For
Owner Type
Purchase Details
Closed on
Feb 9, 2011
Sold by
Talley Brandii and Doumas Brandii
Bought by
Huggins Donald E and Huggins Virginia T
Current Estimated Value
Home Financials for this Owner
Home Financials are based on the most recent Mortgage that was taken out on this home.
Original Mortgage
$68,000
Outstanding Balance
$46,464
Interest Rate
4.75%
Mortgage Type
New Conventional
Estimated Equity
$288,019
Purchase Details
Closed on
Jun 8, 2005
Sold by
Talley James
Bought by
Doumas Brandii
Home Financials for this Owner
Home Financials are based on the most recent Mortgage that was taken out on this home.
Original Mortgage
$184,000
Interest Rate
5.72%
Mortgage Type
Fannie Mae Freddie Mac
Purchase Details
Closed on
Oct 13, 2004
Sold by
Morgan Shawn J
Bought by
Jamke
Create a Home Valuation Report for This Property
The Home Valuation Report is an in-depth analysis detailing your home's value as well as a comparison with similar homes in the area
Home Values in the Area
Average Home Value in this Area
Purchase History
| Date | Buyer | Sale Price | Title Company |
|---|---|---|---|
| Huggins Donald E | $85,000 | Chicago Title Company | |
| Doumas Brandii | -- | Fidelity | |
| Doumas Brandii | $230,000 | Fidelity | |
| Jamke | $151,000 | -- |
Source: Public Records
Mortgage History
| Date | Status | Borrower | Loan Amount |
|---|---|---|---|
| Open | Huggins Donald E | $68,000 | |
| Previous Owner | Doumas Brandii | $184,000 |
Source: Public Records
Tax History
| Year | Tax Paid | Tax Assessment Tax Assessment Total Assessment is a certain percentage of the fair market value that is determined by local assessors to be the total taxable value of land and additions on the property. | Land | Improvement |
|---|---|---|---|---|
| 2025 | $1,132 | $108,887 | $19,212 | $89,675 |
| 2023 | $1,132 | $104,661 | $18,467 | $86,194 |
| 2022 | $1,059 | $102,609 | $18,105 | $84,504 |
| 2021 | $1,043 | $100,598 | $17,750 | $82,848 |
| 2020 | $1,017 | $99,567 | $17,568 | $81,999 |
| 2019 | $1,007 | $97,616 | $17,224 | $80,392 |
| 2018 | $984 | $95,703 | $16,887 | $78,816 |
| 2017 | $971 | $93,827 | $16,556 | $77,271 |
| 2016 | $925 | $91,988 | $16,232 | $75,756 |
| 2015 | $910 | $90,608 | $15,989 | $74,619 |
| 2014 | $893 | $88,834 | $15,676 | $73,158 |
Source: Public Records
Map
Nearby Homes
- 608 Grant Dr
- 1509 Harding Ave
- 0 Avenue 25
- 1105 Orange Ave
- 1108 Kings Ave
- 23760 Road 15
- 1308 Monterey Ave
- 1604 Parkridge Dr
- 569 Englewood Ave
- 1315 Ventura Ave
- 325 S 7th St
- 904 Riverside Ave
- 510 Parkridge Dr
- 175 Oleander Dr
- 1629 Castro Ave
- 344 Rose Ave
- 1116 Sonoma Ave
- 801 Riverside Ave
- 840 Holiday Way
- 581 Victoria Ave
Your Personal Tour Guide
Ask me questions while you tour the home.