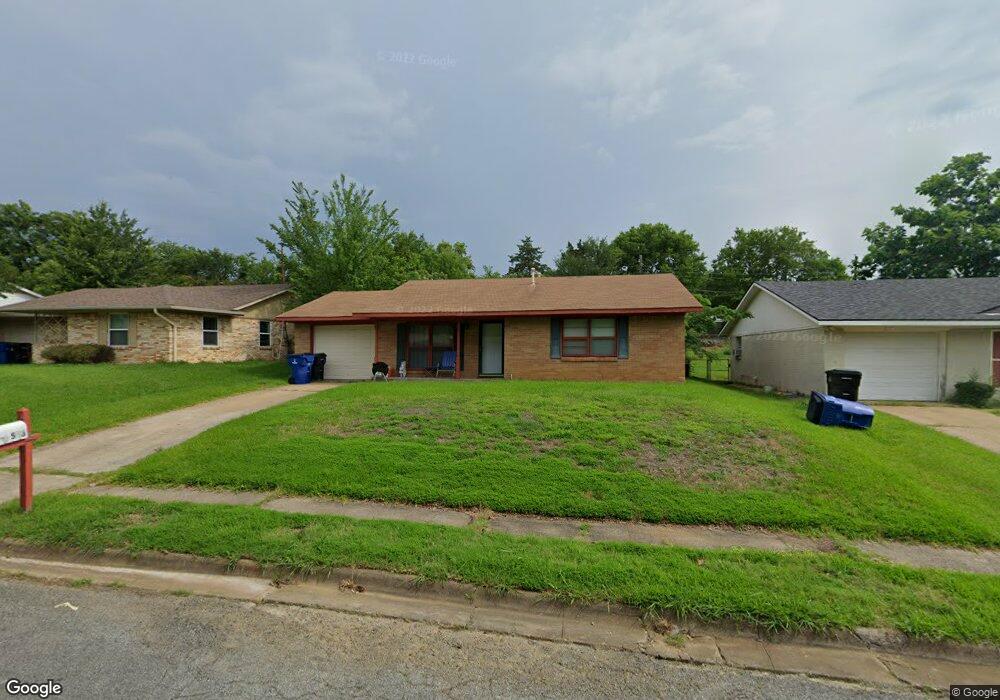
513 Joy Ln Denison, TX 75021
Estimated Value: $172,217 - $181,000
3
Beds
2
Baths
1,126
Sq Ft
$157/Sq Ft
Est. Value
About This Home
This home is located at 513 Joy Ln, Denison, TX 75021 and is currently estimated at $176,609, approximately $156 per square foot. 513 Joy Ln is a home located in Grayson County with nearby schools including Scott Middle School, Denison High School, and St. Luke's Parish Day School.
Ownership History
Date
Name
Owned For
Owner Type
Purchase Details
Closed on
Jun 16, 2015
Sold by
Tucker Ronald M and Tucker Denise R
Bought by
Oshoto Properties Lp
Current Estimated Value
Purchase Details
Closed on
Apr 24, 2015
Sold by
Byers John A and Byers Tisha
Bought by
Tucker Ronald and Tucker Denise
Purchase Details
Closed on
Oct 7, 2008
Sold by
Means Johnny L and Means Rachel N
Bought by
Byers John A
Home Financials for this Owner
Home Financials are based on the most recent Mortgage that was taken out on this home.
Original Mortgage
$66,875
Interest Rate
6.35%
Mortgage Type
Purchase Money Mortgage
Create a Home Valuation Report for This Property
The Home Valuation Report is an in-depth analysis detailing your home's value as well as a comparison with similar homes in the area
Home Values in the Area
Average Home Value in this Area
Purchase History
| Date | Buyer | Sale Price | Title Company |
|---|---|---|---|
| Oshoto Properties Lp | -- | None Available | |
| Tucker Ronald | -- | Chapin Title Co Inc | |
| Byers John A | -- | Chapin Title Co Inc |
Source: Public Records
Mortgage History
| Date | Status | Borrower | Loan Amount |
|---|---|---|---|
| Previous Owner | Byers John A | $66,875 |
Source: Public Records
Tax History Compared to Growth
Tax History
| Year | Tax Paid | Tax Assessment Tax Assessment Total Assessment is a certain percentage of the fair market value that is determined by local assessors to be the total taxable value of land and additions on the property. | Land | Improvement |
|---|---|---|---|---|
| 2025 | $3,308 | $149,844 | $38,976 | $110,868 |
| 2024 | $3,308 | $142,384 | $33,012 | $109,372 |
| 2023 | $3,020 | $133,307 | $33,012 | $100,295 |
| 2022 | $2,716 | $114,293 | $33,012 | $81,281 |
| 2021 | $2,561 | $101,529 | $16,212 | $85,317 |
| 2020 | $2,534 | $96,061 | $16,212 | $79,849 |
| 2019 | $2,562 | $93,096 | $10,752 | $82,344 |
| 2018 | $2,381 | $85,813 | $10,752 | $75,061 |
| 2017 | $2,159 | $77,156 | $10,752 | $66,404 |
| 2016 | $1,848 | $66,039 | $10,752 | $55,287 |
| 2015 | $1,162 | $56,377 | $6,300 | $50,077 |
| 2014 | $1,382 | $58,938 | $6,300 | $52,638 |
Source: Public Records
Map
Nearby Homes