Estimated Value: $95,000 - $130,000
2
Beds
1
Bath
697
Sq Ft
$168/Sq Ft
Est. Value
About This Home
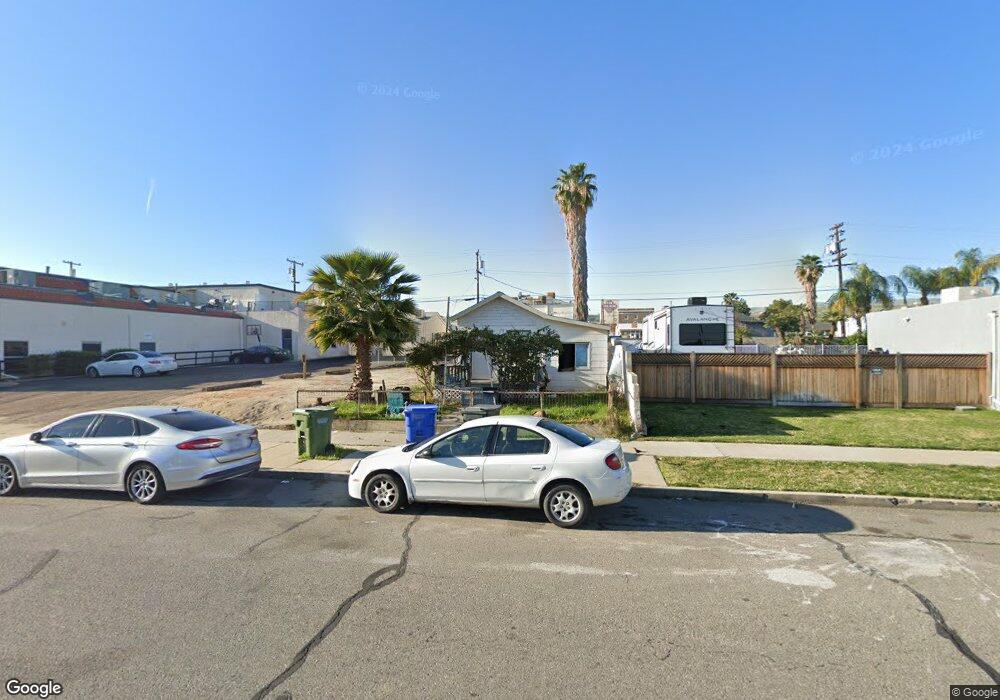
This home is located at 513 Lucard St, Taft, CA 93268 and is currently estimated at $116,778, approximately $167 per square foot. 513 Lucard St is a home located in Kern County with nearby schools including Taft Primary School, Roosevelt Elementary School, and Lincoln Junior High School.
Ownership History
Date
Name
Owned For
Owner Type
Purchase Details
Closed on
Dec 30, 2020
Sold by
Ribas Daniel
Bought by
Ribas Michelle Dulude
Current Estimated Value
Purchase Details
Closed on
Feb 26, 2020
Sold by
Landwehr Charles V and Landwehr Jennifer
Bought by
Sanchez Veronica
Home Financials for this Owner
Home Financials are based on the most recent Mortgage that was taken out on this home.
Original Mortgage
$56,055
Interest Rate
3.6%
Mortgage Type
Commercial
Create a Home Valuation Report for This Property
The Home Valuation Report is an in-depth analysis detailing your home's value as well as a comparison with similar homes in the area
Home Values in the Area
Average Home Value in this Area
Purchase History
| Date | Buyer | Sale Price | Title Company |
|---|---|---|---|
| Ribas Michelle Dulude | -- | Chicago Title | |
| Ribas Michelle Dulude | $26,000 | Chicago Title Company | |
| Sanchez Veronica | $35,000 | Chicago Title Company |
Source: Public Records
Mortgage History
| Date | Status | Borrower | Loan Amount |
|---|---|---|---|
| Previous Owner | Sanchez Veronica | $56,055 |
Source: Public Records
Tax History Compared to Growth
Tax History
| Year | Tax Paid | Tax Assessment Tax Assessment Total Assessment is a certain percentage of the fair market value that is determined by local assessors to be the total taxable value of land and additions on the property. | Land | Improvement |
|---|---|---|---|---|
| 2025 | $2,327 | $88,757 | $21,648 | $67,109 |
| 2024 | $2,147 | $87,018 | $21,224 | $65,794 |
| 2023 | $2,147 | $85,312 | $20,808 | $64,504 |
| 2022 | $2,014 | $83,640 | $20,400 | $63,240 |
| 2021 | $1,889 | $82,000 | $20,000 | $62,000 |
| 2020 | $1,179 | $38,223 | $8,013 | $30,210 |
| 2019 | $1,172 | $38,223 | $8,013 | $30,210 |
| 2018 | $1,161 | $36,740 | $7,702 | $29,038 |
| 2017 | $1,144 | $36,020 | $7,551 | $28,469 |
| 2016 | $1,134 | $35,314 | $7,403 | $27,911 |
| 2015 | $1,054 | $34,784 | $7,292 | $27,492 |
| 2014 | $991 | $34,104 | $7,150 | $26,954 |
Source: Public Records
Map
Nearby Homes