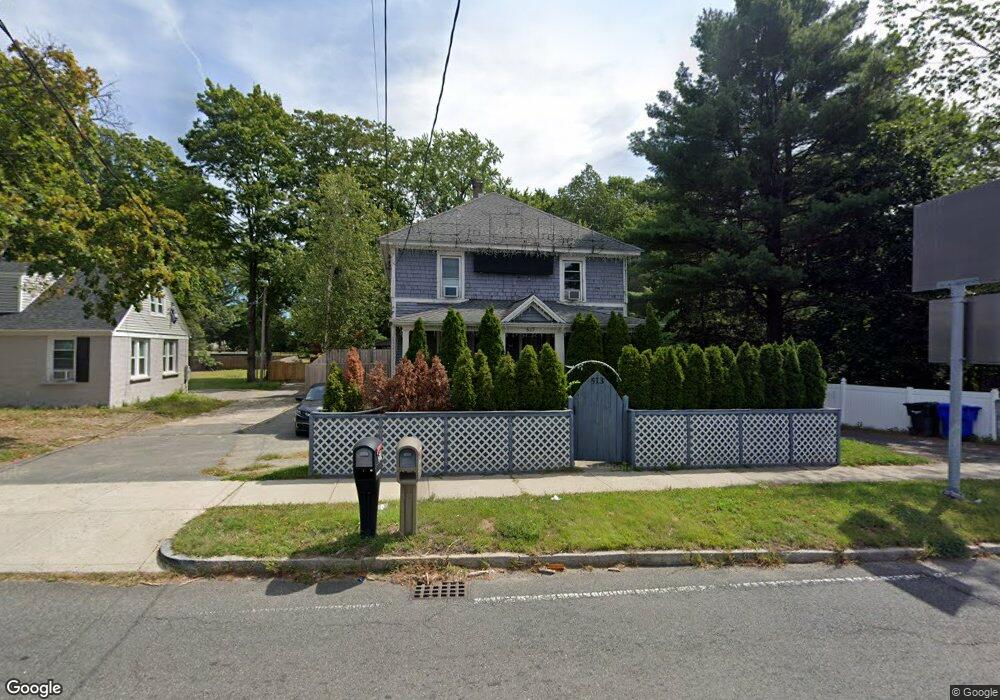
513 Parker St Springfield, MA 01129
Boston Road NeighborhoodEstimated Value: $298,000 - $340,000
4
Beds
2
Baths
1,842
Sq Ft
$173/Sq Ft
Est. Value
About This Home
This home is located at 513 Parker St, Springfield, MA 01129 and is currently estimated at $317,979, approximately $172 per square foot. 513 Parker St is a home located in Hampden County with nearby schools including Warner, M Marcus Kiley Middle, and Springfield Central High School.
Ownership History
Date
Name
Owned For
Owner Type
Purchase Details
Closed on
Oct 1, 2009
Sold by
Hayden Patricia L
Bought by
Hayden Todd A
Current Estimated Value
Purchase Details
Closed on
Sep 25, 1996
Sold by
Syriac Richard J and Ekstrom Joanne F
Bought by
Hayden Patricia L and Hayden Todd A
Create a Home Valuation Report for This Property
The Home Valuation Report is an in-depth analysis detailing your home's value as well as a comparison with similar homes in the area
Home Values in the Area
Average Home Value in this Area
Purchase History
| Date | Buyer | Sale Price | Title Company |
|---|---|---|---|
| Hayden Todd A | -- | -- | |
| Hayden Patricia L | $60,000 | -- |
Source: Public Records
Mortgage History
| Date | Status | Borrower | Loan Amount |
|---|---|---|---|
| Previous Owner | Hayden Patricia L | $20,000 | |
| Previous Owner | Hayden Patricia L | $11,147 | |
| Previous Owner | Hayden Patricia L | $12,364 | |
| Previous Owner | Hayden Patricia L | $59,743 |
Source: Public Records
Tax History Compared to Growth
Tax History
| Year | Tax Paid | Tax Assessment Tax Assessment Total Assessment is a certain percentage of the fair market value that is determined by local assessors to be the total taxable value of land and additions on the property. | Land | Improvement |
|---|---|---|---|---|
| 2025 | $4,190 | $267,200 | $56,500 | $210,700 |
| 2024 | $4,020 | $250,300 | $56,500 | $193,800 |
| 2023 | $3,292 | $193,100 | $53,800 | $139,300 |
| 2022 | $3,335 | $177,200 | $53,800 | $123,400 |
| 2021 | $3,342 | $176,800 | $48,900 | $127,900 |
| 2020 | $2,523 | $129,200 | $48,900 | $80,300 |
| 2019 | $2,419 | $122,900 | $48,900 | $74,000 |
| 2018 | $2,371 | $120,500 | $48,900 | $71,600 |
| 2017 | $2,334 | $118,700 | $44,200 | $74,500 |
| 2016 | $2,098 | $106,700 | $44,200 | $62,500 |
| 2015 | $1,845 | $93,800 | $44,200 | $49,600 |
Source: Public Records
Map
Nearby Homes