Estimated Value: $1,087,000 - $1,285,000
3
Beds
3
Baths
1,866
Sq Ft
$629/Sq Ft
Est. Value
About This Home
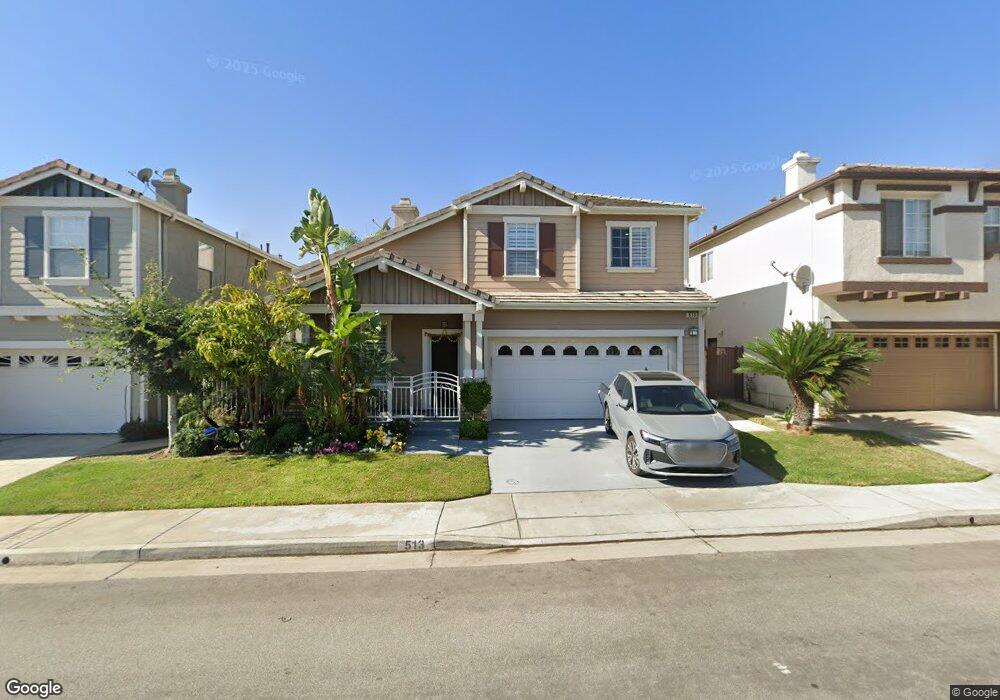
This home is located at 513 Robins Place, Brea, CA 92823 and is currently estimated at $1,174,134, approximately $629 per square foot. 513 Robins Place is a home located in Orange County with nearby schools including Olinda Elementary School, Brea Junior High School, and Brea-Olinda High School.
Ownership History
Date
Name
Owned For
Owner Type
Purchase Details
Closed on
Mar 24, 2009
Sold by
Jogiraju Mythili
Bought by
Veldanda Kulkarni
Current Estimated Value
Purchase Details
Closed on
Jan 13, 2009
Sold by
Chirco Joseph A
Bought by
Veldanda Kulkarni
Home Financials for this Owner
Home Financials are based on the most recent Mortgage that was taken out on this home.
Original Mortgage
$540,038
Interest Rate
5.15%
Mortgage Type
FHA
Purchase Details
Closed on
Mar 27, 2002
Sold by
Kb Home Coastal Inc
Bought by
Chirco Joseph A
Home Financials for this Owner
Home Financials are based on the most recent Mortgage that was taken out on this home.
Original Mortgage
$220,700
Interest Rate
6.84%
Create a Home Valuation Report for This Property
The Home Valuation Report is an in-depth analysis detailing your home's value as well as a comparison with similar homes in the area
Home Values in the Area
Average Home Value in this Area
Purchase History
| Date | Buyer | Sale Price | Title Company |
|---|---|---|---|
| Veldanda Kulkarni | -- | Lawyers Title Company | |
| Veldanda Kulkarni | $550,000 | Lawyers Title Company | |
| Chirco Joseph A | $276,000 | First American Title Co |
Source: Public Records
Mortgage History
| Date | Status | Borrower | Loan Amount |
|---|---|---|---|
| Previous Owner | Veldanda Kulkarni | $540,038 | |
| Previous Owner | Chirco Joseph A | $220,700 |
Source: Public Records
Tax History
| Year | Tax Paid | Tax Assessment Tax Assessment Total Assessment is a certain percentage of the fair market value that is determined by local assessors to be the total taxable value of land and additions on the property. | Land | Improvement |
|---|---|---|---|---|
| 2025 | $8,880 | $708,263 | $424,061 | $284,202 |
| 2024 | $8,880 | $694,376 | $415,746 | $278,630 |
| 2023 | $8,688 | $680,761 | $407,594 | $273,167 |
| 2022 | $8,625 | $667,413 | $399,602 | $267,811 |
| 2021 | $8,470 | $654,327 | $391,767 | $262,560 |
| 2020 | $8,418 | $647,618 | $387,750 | $259,868 |
| 2019 | $8,219 | $634,920 | $380,147 | $254,773 |
| 2018 | $8,347 | $622,471 | $372,693 | $249,778 |
| 2017 | $8,220 | $610,266 | $365,385 | $244,881 |
| 2016 | $8,099 | $598,300 | $358,220 | $240,080 |
| 2015 | $7,997 | $589,313 | $352,839 | $236,474 |
| 2014 | $7,231 | $526,752 | $306,051 | $220,701 |
Source: Public Records
Map
Nearby Homes
- 404 Condor Ave
- 3174 E Piru Ln
- 460 N Aera Ct
- 3112 E Piru Ln
- 149 Bluegrass St
- 2761 E Stearns St
- 3111 Gardenia Ln
- 3408 Urbana Ln
- 878 N Landa Way
- 409 Mallorca Ln
- 3730 Glorietta Place
- 2583 Sandpebble Ln
- 17265 Blue Spruce Ln
- 3378 Merida Ln
- 3702 E Mercado Dr
- 2498 E Santa Paula Dr
- 17175 Sweet Bay Ct
- 2363 Morning Dew Dr
- 16776 Lake Terrace Way Unit 247
- 364 Vesuvius Dr
- 523 Robins Place
- 503 Robins Place
- 512 Condor Ave
- 522 Condor Ave
- 502 Condor Ave
- 533 Robins Place
- 532 Condor Ave
- 514 Robins Place
- 524 Robins Place
- 504 Robins Place
- 543 Robins Place
- 534 Robins Place
- 542 Condor Ave
- 3684 Roadrunner Dr
- 3676 Roadrunner Dr
- 3692 Roadrunner Dr
- 3668 Roadrunner Dr
- 544 Robins Place
- 553 Robins Place
- 3702 Roadrunner Dr
Your Personal Tour Guide
Ask me questions while you tour the home.