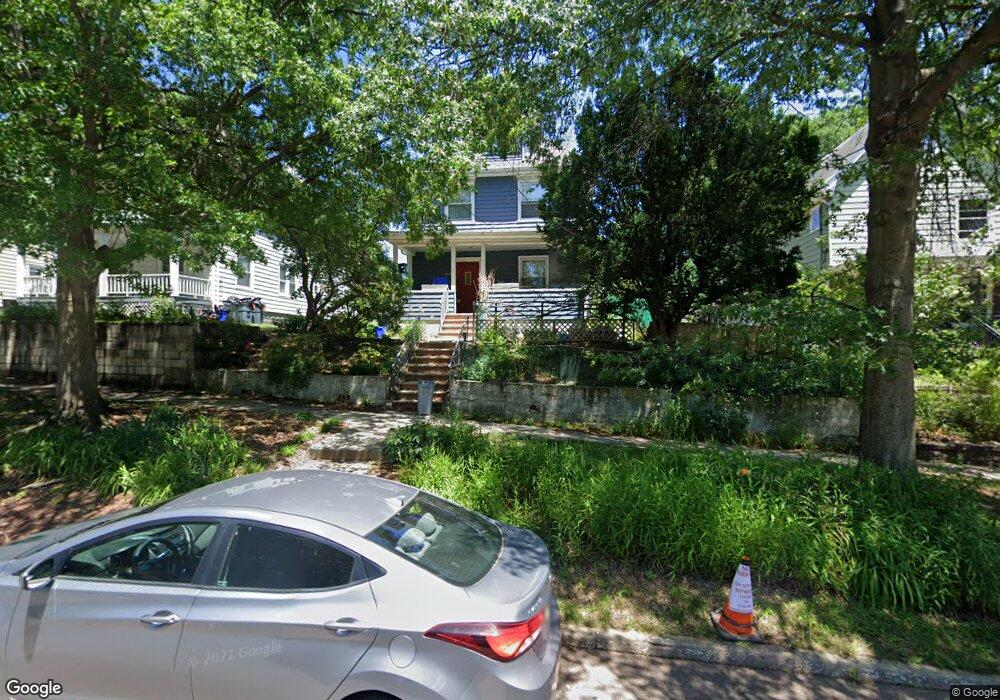
513 S 3rd Ave Highland Park, NJ 08904
Estimated Value: $508,000 - $591,975
--
Bed
--
Bath
1,848
Sq Ft
$307/Sq Ft
Est. Value
About This Home
This home is located at 513 S 3rd Ave, Highland Park, NJ 08904 and is currently estimated at $567,994, approximately $307 per square foot. 513 S 3rd Ave is a home located in Middlesex County with nearby schools including Irving Primary School, Bartle School, and Highland Park Middle School.
Ownership History
Date
Name
Owned For
Owner Type
Purchase Details
Closed on
Jul 11, 2002
Sold by
Syracuse Louis
Bought by
Au Ka Neng and Au Eunice
Current Estimated Value
Home Financials for this Owner
Home Financials are based on the most recent Mortgage that was taken out on this home.
Original Mortgage
$113,000
Outstanding Balance
$47,563
Interest Rate
6.61%
Estimated Equity
$520,431
Purchase Details
Closed on
Sep 1, 1993
Sold by
Borce Alan
Bought by
Neng Ka and Au Eunice
Home Financials for this Owner
Home Financials are based on the most recent Mortgage that was taken out on this home.
Original Mortgage
$165,000
Interest Rate
7.11%
Create a Home Valuation Report for This Property
The Home Valuation Report is an in-depth analysis detailing your home's value as well as a comparison with similar homes in the area
Home Values in the Area
Average Home Value in this Area
Purchase History
| Date | Buyer | Sale Price | Title Company |
|---|---|---|---|
| Au Ka Neng | $42,000 | -- | |
| Neng Ka | $168,500 | -- |
Source: Public Records
Mortgage History
| Date | Status | Borrower | Loan Amount |
|---|---|---|---|
| Open | Au Ka Neng | $113,000 | |
| Previous Owner | Neng Ka | $165,000 |
Source: Public Records
Tax History Compared to Growth
Tax History
| Year | Tax Paid | Tax Assessment Tax Assessment Total Assessment is a certain percentage of the fair market value that is determined by local assessors to be the total taxable value of land and additions on the property. | Land | Improvement |
|---|---|---|---|---|
| 2025 | $12,787 | $499,100 | $210,000 | $289,100 |
| 2024 | $12,468 | $499,100 | $210,000 | $289,100 |
| 2023 | $12,468 | $499,100 | $210,000 | $289,100 |
| 2022 | $12,256 | $143,800 | $68,500 | $75,300 |
| 2021 | $6,046 | $143,800 | $68,500 | $75,300 |
| 2020 | $12,092 | $143,800 | $68,500 | $75,300 |
| 2019 | $12,101 | $143,800 | $68,500 | $75,300 |
| 2018 | $11,756 | $143,800 | $68,500 | $75,300 |
| 2017 | $11,297 | $143,800 | $68,500 | $75,300 |
| 2016 | $11,357 | $143,800 | $68,500 | $75,300 |
| 2015 | $10,932 | $143,800 | $68,500 | $75,300 |
| 2014 | $10,753 | $143,800 | $68,500 | $75,300 |
Source: Public Records
Map
Nearby Homes