513 S 660 E Unit 118 Smithfield, UT 84335
Estimated Value: $508,000 - $562,000
--
Bed
--
Bath
1,397
Sq Ft
$385/Sq Ft
Est. Value
About This Home
This home is located at 513 S 660 E Unit 118, Smithfield, UT 84335 and is currently estimated at $538,300, approximately $385 per square foot. 513 S 660 E Unit 118 is a home located in Cache County with nearby schools including Sunrise School, Cedar Ridge School, and Cedar Ridge Middle School.
Ownership History
Date
Name
Owned For
Owner Type
Purchase Details
Closed on
Apr 3, 2020
Sold by
Barrett Bridger and Barrett Heather S
Bought by
Hansen Devin and Hansen Lauren
Current Estimated Value
Home Financials for this Owner
Home Financials are based on the most recent Mortgage that was taken out on this home.
Original Mortgage
$325,800
Outstanding Balance
$287,363
Interest Rate
3.4%
Mortgage Type
New Conventional
Estimated Equity
$250,937
Purchase Details
Closed on
Feb 26, 2016
Sold by
East Sky View Development Inc
Bought by
Solid Homes Inc and Lifestyle Homes
Home Financials for this Owner
Home Financials are based on the most recent Mortgage that was taken out on this home.
Original Mortgage
$208,800
Interest Rate
3.92%
Mortgage Type
Construction
Create a Home Valuation Report for This Property
The Home Valuation Report is an in-depth analysis detailing your home's value as well as a comparison with similar homes in the area
Home Values in the Area
Average Home Value in this Area
Purchase History
| Date | Buyer | Sale Price | Title Company |
|---|---|---|---|
| Hansen Devin | -- | Hickman Land Title Co | |
| Solid Homes Inc | -- | Hickman Land Title Company |
Source: Public Records
Mortgage History
| Date | Status | Borrower | Loan Amount |
|---|---|---|---|
| Open | Hansen Devin | $325,800 | |
| Previous Owner | Solid Homes Inc | $208,800 |
Source: Public Records
Tax History Compared to Growth
Tax History
| Year | Tax Paid | Tax Assessment Tax Assessment Total Assessment is a certain percentage of the fair market value that is determined by local assessors to be the total taxable value of land and additions on the property. | Land | Improvement |
|---|---|---|---|---|
| 2025 | $2,163 | $289,605 | $0 | $0 |
| 2024 | $2,427 | $304,755 | $0 | $0 |
| 2023 | $2,522 | $299,475 | $0 | $0 |
| 2022 | $2,563 | $299,475 | $0 | $0 |
| 2021 | $1,891 | $337,635 | $75,000 | $262,635 |
| 2020 | $1,822 | $303,379 | $75,000 | $228,379 |
| 2019 | $1,798 | $285,379 | $57,000 | $228,379 |
| 2018 | $1,699 | $260,910 | $57,000 | $203,910 |
| 2017 | $1,647 | $138,160 | $0 | $0 |
| 2016 | $1,676 | $57,000 | $0 | $0 |
Source: Public Records
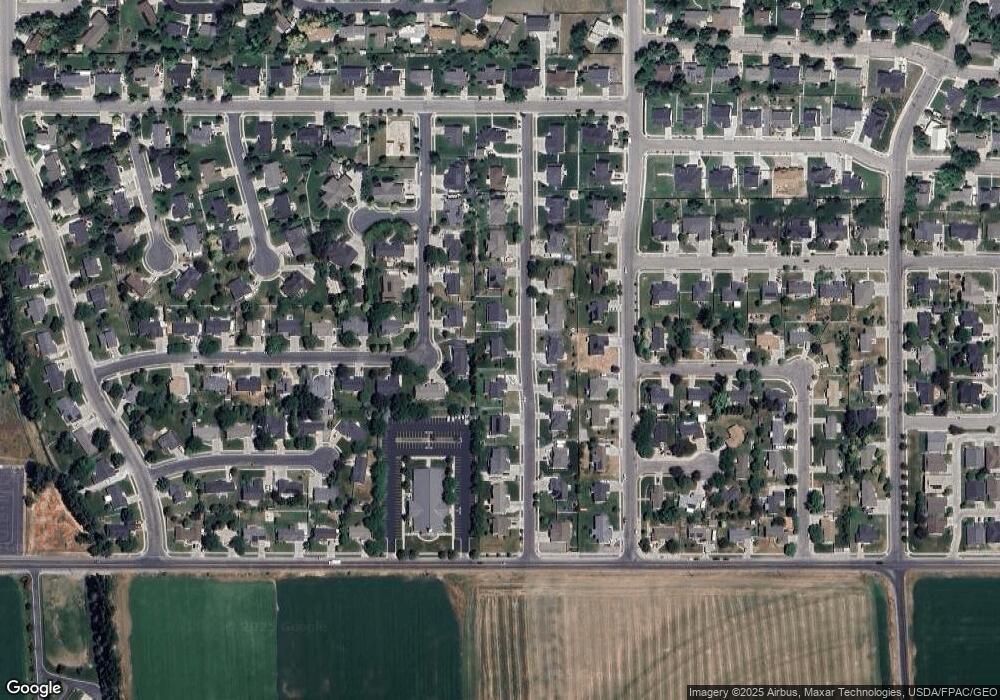
Map
Nearby Homes
- 709 E 500 S
- 781 E 450 S
- 462 E 520 S
- 496 S 455 E
- 528 E 300 S
- 396 S 455 E
- 851 E 400 S
- 878 E 400 S
- 579 E 260 S
- 890 E 450 S
- 350 E 400 S
- 267 S 980 E
- Brantwood Plan at Sky View Heights
- Kensington Plan at Sky View Heights
- Cambria Plan at Sky View Heights
- Stanton Plan at Sky View Heights
- Denford Plan at Sky View Heights
- 260 S 370 E
- 434 S Cardon Ridge Dr
- 993 E 270 S
- 513 S 660 E
- 497 S 660 E
- 497 S 660 E Unit 117
- 527 S 660 E Unit 119
- 522 S 620 E
- 504 S 620 E
- 514 S 660 E
- 514 S 660 E Unit 129
- 485 S 660 E Unit 116
- 485 S 660 E
- 498 S 660 E Unit 128
- 528 S 660 E Unit 130
- 488 S 620 E
- 543 S 660 E Unit 120
- 618 E 520 S
- 486 S 660 E
- 544 S 660 E
- 544 S 660 E Unit 131
- 521 S 700 E
- 469 S 660 E