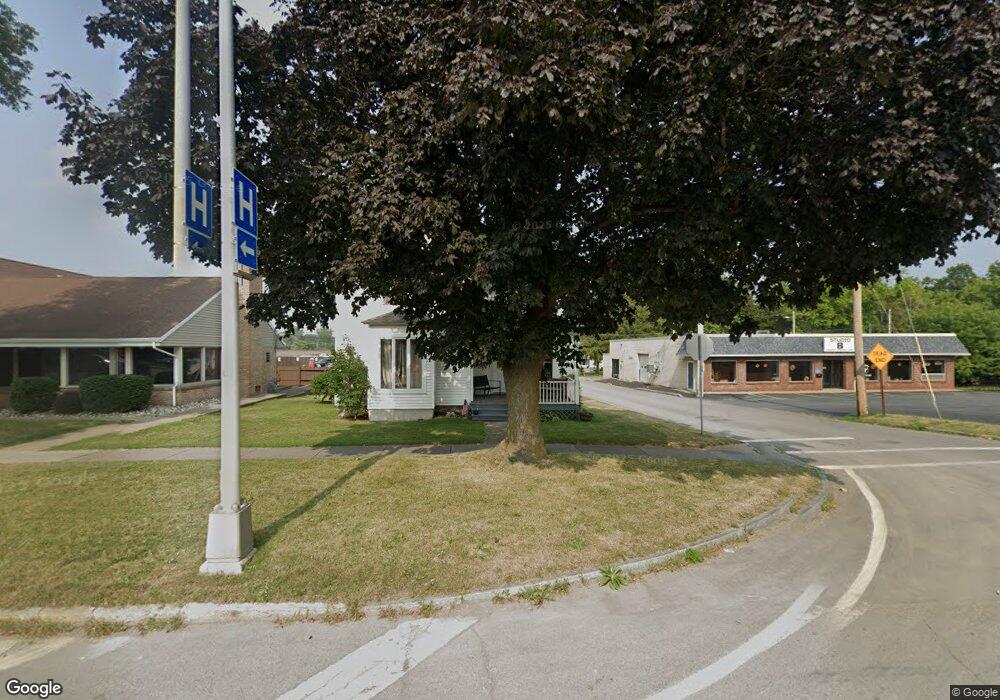
513 S Main St Canandaigua, NY 14424
Estimated Value: $192,000 - $293,000
3
Beds
2
Baths
1,640
Sq Ft
$143/Sq Ft
Est. Value
About This Home
This home is located at 513 S Main St, Canandaigua, NY 14424 and is currently estimated at $234,025, approximately $142 per square foot. 513 S Main St is a home located in Ontario County with nearby schools including Canandaigua Primary-Elementary School, Canandaigua Middle School, and Canandaigua Academy.
Ownership History
Date
Name
Owned For
Owner Type
Purchase Details
Closed on
Nov 11, 2014
Sold by
Stone Timothy
Bought by
Cms Commercial Properties Llc
Current Estimated Value
Purchase Details
Closed on
May 21, 2014
Sold by
Wells Brian
Bought by
Stone Timothy
Home Financials for this Owner
Home Financials are based on the most recent Mortgage that was taken out on this home.
Original Mortgage
$25,000
Interest Rate
4.33%
Create a Home Valuation Report for This Property
The Home Valuation Report is an in-depth analysis detailing your home's value as well as a comparison with similar homes in the area
Home Values in the Area
Average Home Value in this Area
Purchase History
| Date | Buyer | Sale Price | Title Company |
|---|---|---|---|
| Cms Commercial Properties Llc | -- | Edward Kenyon | |
| Stone Timothy | $118,000 | Kenyon & Kenyon |
Source: Public Records
Mortgage History
| Date | Status | Borrower | Loan Amount |
|---|---|---|---|
| Previous Owner | Stone Timothy | $25,000 | |
| Previous Owner | Stone Timothy | $93,200 |
Source: Public Records
Tax History Compared to Growth
Tax History
| Year | Tax Paid | Tax Assessment Tax Assessment Total Assessment is a certain percentage of the fair market value that is determined by local assessors to be the total taxable value of land and additions on the property. | Land | Improvement |
|---|---|---|---|---|
| 2024 | $3,090 | $154,000 | $25,700 | $128,300 |
| 2023 | $2,717 | $112,000 | $22,000 | $90,000 |
| 2022 | $2,691 | $112,000 | $22,000 | $90,000 |
| 2021 | $2,773 | $112,000 | $22,000 | $90,000 |
| 2020 | $2,728 | $103,000 | $22,000 | $81,000 |
| 2019 | $3,294 | $103,000 | $22,000 | $81,000 |
| 2018 | $1,950 | $103,000 | $22,000 | $81,000 |
| 2017 | $1,970 | $103,000 | $22,000 | $81,000 |
| 2016 | $1,891 | $98,000 | $22,000 | $76,000 |
| 2015 | $1,892 | $98,000 | $22,000 | $76,000 |
| 2014 | -- | $98,000 | $22,000 | $76,000 |
Source: Public Records
Map
Nearby Homes
- 280 S Main St
- 25 Saltonstall St
- 140A Holiday Harbour Unit 140C
- 128 Saltonstall St
- 287 Mason St
- 146 Pleasant St
- 469 S Pearl St
- 87 Phoenix St
- 74 Pleasant St
- 261 S Pearl St
- 38 Chapin St
- 0 County Road 4
- 0 Cr-32 Unit R1614194
- 0 Cr-32 Unit R1614204
- 179 Telyea St
- 12 Calman Place
- 126 Chapin St
- 50 Deerfield Dr
- 31 Deerfield Dr
- 127 Park Ave