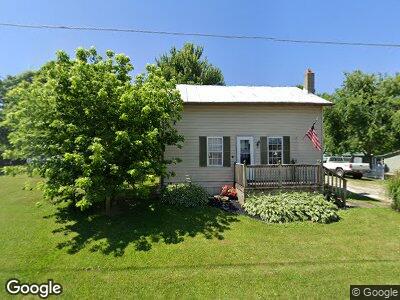
513 State Route 603 W Shiloh, OH 44878
Estimated Value: $68,342 - $256,000
2
Beds
1
Bath
915
Sq Ft
$139/Sq Ft
Est. Value
About This Home
This home is located at 513 State Route 603 W, Shiloh, OH 44878 and is currently estimated at $127,336, approximately $139 per square foot. 513 State Route 603 W is a home located in Richland County with nearby schools including Shiloh Elementary School, Shiloh Middle School, and Plymouth High School.
Ownership History
Date
Name
Owned For
Owner Type
Purchase Details
Closed on
Sep 8, 2006
Sold by
Shepherd Lacy and Shephed Pamala M
Bought by
Moore Wallace and Moore Judy A
Current Estimated Value
Home Financials for this Owner
Home Financials are based on the most recent Mortgage that was taken out on this home.
Original Mortgage
$49,000
Outstanding Balance
$30,624
Interest Rate
6.77%
Mortgage Type
Purchase Money Mortgage
Estimated Equity
$88,292
Purchase Details
Closed on
Jan 31, 2001
Sold by
Conley Theresa L
Bought by
Shepherd Lacy
Home Financials for this Owner
Home Financials are based on the most recent Mortgage that was taken out on this home.
Original Mortgage
$17,000
Interest Rate
6.91%
Mortgage Type
New Conventional
Purchase Details
Closed on
Jul 1, 1994
Sold by
Horn Hezikiah
Bought by
Conley Delbert D and Conley Theresa L
Home Financials for this Owner
Home Financials are based on the most recent Mortgage that was taken out on this home.
Original Mortgage
$7,125
Interest Rate
8.66%
Mortgage Type
New Conventional
Purchase Details
Closed on
Jun 1, 1985
Create a Home Valuation Report for This Property
The Home Valuation Report is an in-depth analysis detailing your home's value as well as a comparison with similar homes in the area
Home Values in the Area
Average Home Value in this Area
Purchase History
| Date | Buyer | Sale Price | Title Company |
|---|---|---|---|
| Moore Wallace | $49,000 | Southern Title | |
| Shepherd Lacy | $6,010 | -- | |
| Conley Delbert D | $8,500 | -- | |
| -- | $15,000 | -- |
Source: Public Records
Mortgage History
| Date | Status | Borrower | Loan Amount |
|---|---|---|---|
| Open | Moore Wallace | $49,000 | |
| Closed | Shepherd Lacy | $17,000 | |
| Previous Owner | Conley Delbert D | $7,125 |
Source: Public Records
Tax History Compared to Growth
Tax History
| Year | Tax Paid | Tax Assessment Tax Assessment Total Assessment is a certain percentage of the fair market value that is determined by local assessors to be the total taxable value of land and additions on the property. | Land | Improvement |
|---|---|---|---|---|
| 2024 | $434 | $11,840 | $1,530 | $10,310 |
| 2023 | $434 | $11,840 | $1,530 | $10,310 |
| 2022 | $383 | $9,070 | $1,430 | $7,640 |
| 2021 | $385 | $9,070 | $1,430 | $7,640 |
| 2020 | $404 | $9,070 | $1,430 | $7,640 |
| 2019 | $351 | $7,680 | $1,210 | $6,470 |
| 2018 | $349 | $7,680 | $1,210 | $6,470 |
| 2017 | $337 | $7,680 | $1,210 | $6,470 |
| 2016 | $331 | $7,760 | $1,210 | $6,550 |
| 2015 | $330 | $7,760 | $1,210 | $6,550 |
| 2014 | $336 | $7,760 | $1,210 | $6,550 |
| 2012 | $159 | $7,760 | $1,210 | $6,550 |
Source: Public Records
Map
Nearby Homes
- 2230 Shelby-Ganges Rd
- 627 Taylortown Rd
- 1282 Taylortown Rd
- 2724 Country Meadows Dr
- 4798 Vermillion St
- 1023 Ohio 545
- 0 Technology Pkwy
- 3995 Dinninger Rd
- 65 S Kniffin St
- 4 Presidential Blvd
- 99 E Whitney Ave
- 34 Clark Ave
- 0 Glenwood
- 21 4th St
- 719 Park View Ct
- 101 2nd St
- 54 Edgewood Dr
- 54 E Smiley Ave
- 64 Edgewood Dr
- 58 E Whitney Ave
- 513 State Route 603 W
- 505 State Route 603 W
- 505 State Route 603 W
- 517 State Route 603 W
- 510 State Route 603 W
- 510 Ohio 603
- 517 Ohio 603
- 522 State Route 603 W
- 541 State Route 603 W
- 489 State Route 603 W
- 494 State Route 603 W
- 484 State Route 603 W
- 6225 Rome South Rd
- 534 State Route 603 W
- 481 State Route 603 W
- 6261 Rome Greenwich Rd
- 6305 Rome Greenwich Rd
- 6305 Rome Greenwich Rd
- 469 State Route 603 W
- 6246 Rome South Rd