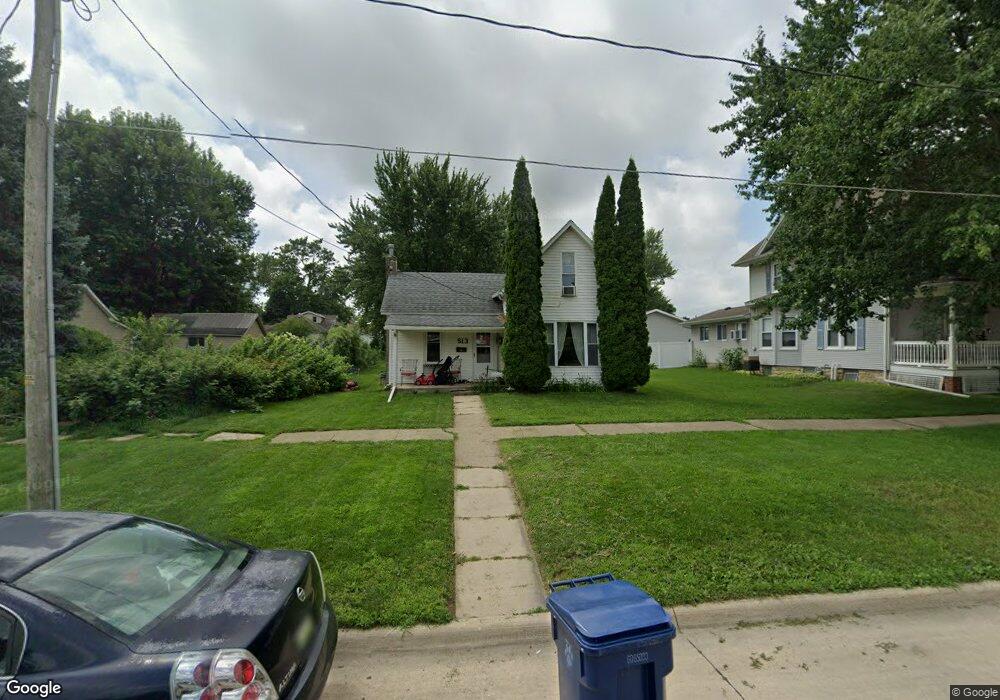
513 W 5th St Tipton, IA 52772
Estimated Value: $121,000 - $149,000
2
Beds
1
Bath
820
Sq Ft
$160/Sq Ft
Est. Value
About This Home
This home is located at 513 W 5th St, Tipton, IA 52772 and is currently estimated at $131,077, approximately $159 per square foot. 513 W 5th St is a home located in Cedar County with nearby schools including Tipton Elementary School, Tipton Middle School, and Tipton High School.
Ownership History
Date
Name
Owned For
Owner Type
Purchase Details
Closed on
Jan 25, 2019
Sold by
Motgomery Brit C and Montgomery Brenda R
Bought by
Montgomery Kyle
Current Estimated Value
Home Financials for this Owner
Home Financials are based on the most recent Mortgage that was taken out on this home.
Original Mortgage
$40,483
Outstanding Balance
$25,358
Interest Rate
4.5%
Mortgage Type
New Conventional
Estimated Equity
$105,719
Purchase Details
Closed on
Apr 5, 2006
Sold by
Montgomery Janet K
Bought by
Montgomery Britt C
Create a Home Valuation Report for This Property
The Home Valuation Report is an in-depth analysis detailing your home's value as well as a comparison with similar homes in the area
Home Values in the Area
Average Home Value in this Area
Purchase History
| Date | Buyer | Sale Price | Title Company |
|---|---|---|---|
| Montgomery Kyle | $60,000 | -- | |
| Montgomery Britt C | $40,000 | None Available |
Source: Public Records
Mortgage History
| Date | Status | Borrower | Loan Amount |
|---|---|---|---|
| Open | Montgomery Kyle | $40,483 |
Source: Public Records
Tax History Compared to Growth
Tax History
| Year | Tax Paid | Tax Assessment Tax Assessment Total Assessment is a certain percentage of the fair market value that is determined by local assessors to be the total taxable value of land and additions on the property. | Land | Improvement |
|---|---|---|---|---|
| 2025 | $1,462 | $88,700 | $13,750 | $74,950 |
| 2024 | $1,462 | $81,210 | $13,750 | $67,460 |
| 2023 | $1,294 | $75,090 | $13,750 | $61,340 |
| 2022 | $1,180 | $59,980 | $11,250 | $48,730 |
| 2021 | $1,102 | $59,980 | $11,250 | $48,730 |
| 2020 | $1,038 | $57,270 | $11,250 | $46,020 |
| 2019 | $1,078 | $58,250 | $11,250 | $46,020 |
| 2018 | $1,046 | $58,250 | $0 | $0 |
| 2017 | $1,046 | $57,460 | $0 | $0 |
| 2016 | $1,058 | $57,460 | $0 | $0 |
| 2015 | $1,080 | $56,980 | $0 | $0 |
| 2014 | $1,062 | $56,980 | $0 | $0 |
Source: Public Records
Map
Nearby Homes