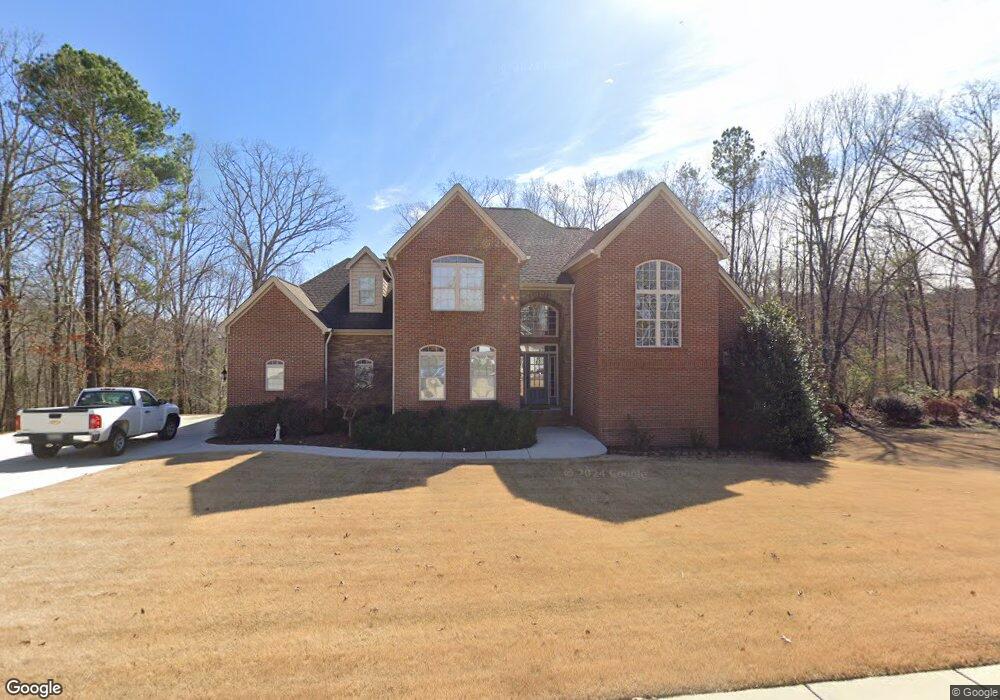
513 Winding Ridge Rd Rock Spring, GA 30739
Rock Spring NeighborhoodEstimated Value: $428,000 - $581,000
--
Bed
3
Baths
2,484
Sq Ft
$199/Sq Ft
Est. Value
About This Home
This home is located at 513 Winding Ridge Rd, Rock Spring, GA 30739 and is currently estimated at $493,196, approximately $198 per square foot. 513 Winding Ridge Rd is a home located in Walker County with nearby schools including Lafayette High School.
Ownership History
Date
Name
Owned For
Owner Type
Purchase Details
Closed on
Jul 28, 2016
Bought by
Fisher Scott and Fisher Joy
Current Estimated Value
Purchase Details
Closed on
Jun 13, 2008
Sold by
Nance Don
Bought by
Fisher Scott and Fisher Joy
Home Financials for this Owner
Home Financials are based on the most recent Mortgage that was taken out on this home.
Original Mortgage
$300,000
Interest Rate
5.97%
Mortgage Type
New Conventional
Purchase Details
Closed on
Jul 31, 2006
Sold by
Not Provided
Bought by
Fisher Scott and Fisher Joy
Purchase Details
Closed on
Jul 27, 2006
Sold by
Bell Ken
Bought by
Nance Don
Purchase Details
Closed on
Aug 4, 2005
Sold by
Catlett Development Llc
Bought by
Bell Ken and Bell Karen
Purchase Details
Closed on
Aug 1, 2005
Sold by
Not Provided
Bought by
Fisher Scott and Fisher Joy
Purchase Details
Closed on
Jul 30, 1999
Bought by
Catlett Developement Llc
Create a Home Valuation Report for This Property
The Home Valuation Report is an in-depth analysis detailing your home's value as well as a comparison with similar homes in the area
Home Values in the Area
Average Home Value in this Area
Purchase History
| Date | Buyer | Sale Price | Title Company |
|---|---|---|---|
| Fisher Scott | $12,100 | -- | |
| Fisher Scott | $374,073 | -- | |
| Fisher Scott | -- | -- | |
| Nance Don | -- | -- | |
| Bell Ken | $30,000 | -- | |
| Fisher Scott | $30,000 | -- | |
| Catlett Developement Llc | -- | -- |
Source: Public Records
Mortgage History
| Date | Status | Borrower | Loan Amount |
|---|---|---|---|
| Previous Owner | Fisher Scott | $300,000 |
Source: Public Records
Tax History Compared to Growth
Tax History
| Year | Tax Paid | Tax Assessment Tax Assessment Total Assessment is a certain percentage of the fair market value that is determined by local assessors to be the total taxable value of land and additions on the property. | Land | Improvement |
|---|---|---|---|---|
| 2024 | $4,536 | $206,227 | $21,000 | $185,227 |
| 2023 | $4,420 | $196,544 | $21,000 | $175,544 |
| 2022 | $4,280 | $173,546 | $21,000 | $152,546 |
| 2021 | $4,163 | $152,248 | $18,000 | $134,248 |
| 2020 | $3,655 | $127,642 | $18,000 | $109,642 |
| 2019 | $3,723 | $127,642 | $18,000 | $109,642 |
| 2018 | $3,377 | $127,642 | $18,000 | $109,642 |
| 2017 | $3,140 | $96,518 | $12,000 | $84,518 |
| 2016 | $2,492 | $96,518 | $12,000 | $84,518 |
| 2015 | $3,062 | $112,554 | $12,000 | $100,554 |
| 2014 | $2,905 | $112,554 | $12,000 | $100,554 |
| 2013 | -- | $112,553 | $12,000 | $100,553 |
Source: Public Records
Map
Nearby Homes
- 788 Long Hollow Rd
- 183 Long Hollow Rd
- 294 E Long Hollow Rd
- 1121 Arnold Rd
- 103 Deer Ridge Ln
- 200 Hunting Ridge Cir
- 54 Cedar Farm Ln
- 124 Fieldstone Commons
- 1476 Arnold Rd
- 453 Harvest Ln
- 918 Old Lafayette Rd
- 36 Pheonix Cir
- 195 Honeysuckle Dr
- 285 Cooper Rd
- 59 Honeysuckle Dr
- 386 Twelve Oaks Dr
- 375 Cooper Rd
- 28 Cobblestone Trail
- 149 Stone Throw Ln
- 135 Stone Throw Ln
- 532 Winding Ridge Rd
- 512 Winding Ridge Rd
- 552 Winding Ridge Rd
- 473 Winding Ridge Rd
- 577 Winding Ridge Rd
- 476 Winding Ridge Rd
- 455 Winding Ridge Rd
- 455 Winding Ridge Rd Unit 38
- 576 Winding Ridge Rd
- 39 Saddle Brooke Ln
- 585 Winding Ridge Rd
- 437 Winding Ridge Rd
- 432 Winding Ridge Rd
- 432 Winding Ridge Rd Unit 22
- 56 Saddle Brooke Ln
- 417 Winding Ridge Rd
- 584 Winding Ridge Rd
- 384 Winding Ridge Rd
- 759 Arnold Rd
- 399 Winding Ridge Rd