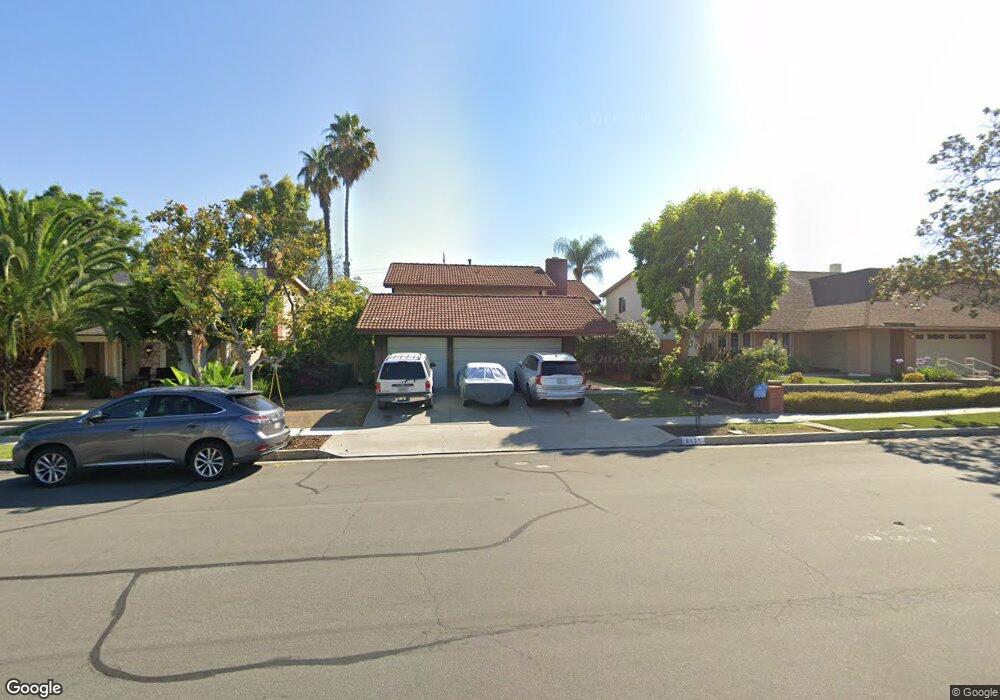
5131 Bordeaux Ave Irvine, CA 92604
Walnut NeighborhoodEstimated Value: $1,634,000 - $1,881,000
4
Beds
3
Baths
2,091
Sq Ft
$824/Sq Ft
Est. Value
About This Home
This home is located at 5131 Bordeaux Ave, Irvine, CA 92604 and is currently estimated at $1,722,102, approximately $823 per square foot. 5131 Bordeaux Ave is a home located in Orange County with nearby schools including Deerfield Elementary School, Venado Middle School, and Irvine High School.
Ownership History
Date
Name
Owned For
Owner Type
Purchase Details
Closed on
Jul 12, 2019
Sold by
Karakashian Hollis Michael Edward and Karakashian Hollis Carina
Bought by
Karakashian Hollis Michael Edward and Karakashian Hollis Carina
Current Estimated Value
Purchase Details
Closed on
Aug 12, 2010
Sold by
Tanaka Kunihide and Tanaka Kyoko
Bought by
Hollis Michael E and Hollis Carina K
Home Financials for this Owner
Home Financials are based on the most recent Mortgage that was taken out on this home.
Original Mortgage
$480,000
Outstanding Balance
$314,748
Interest Rate
4.38%
Mortgage Type
New Conventional
Estimated Equity
$1,407,354
Purchase Details
Closed on
Jun 12, 2006
Sold by
Tanaka K and Tanaka Kyoko
Bought by
Tanaka Kunihide and Tanaka Kyoko
Home Financials for this Owner
Home Financials are based on the most recent Mortgage that was taken out on this home.
Original Mortgage
$308,000
Interest Rate
1%
Mortgage Type
Negative Amortization
Create a Home Valuation Report for This Property
The Home Valuation Report is an in-depth analysis detailing your home's value as well as a comparison with similar homes in the area
Home Values in the Area
Average Home Value in this Area
Purchase History
| Date | Buyer | Sale Price | Title Company |
|---|---|---|---|
| Karakashian Hollis Michael Edward | -- | None Available | |
| Karakashian Hollis Michael Edward | -- | None Available | |
| Hollis Michael E | $600,000 | Chicago Title Company Oc | |
| Tanaka Kunihide | -- | Chicago Title Co |
Source: Public Records
Mortgage History
| Date | Status | Borrower | Loan Amount |
|---|---|---|---|
| Open | Hollis Michael E | $480,000 | |
| Previous Owner | Tanaka Kunihide | $308,000 |
Source: Public Records
Tax History Compared to Growth
Tax History
| Year | Tax Paid | Tax Assessment Tax Assessment Total Assessment is a certain percentage of the fair market value that is determined by local assessors to be the total taxable value of land and additions on the property. | Land | Improvement |
|---|---|---|---|---|
| 2025 | $8,450 | $811,336 | $621,782 | $189,554 |
| 2024 | $8,450 | $795,428 | $609,590 | $185,838 |
| 2023 | $7,811 | $738,851 | $597,637 | $141,214 |
| 2022 | $7,663 | $724,364 | $585,918 | $138,446 |
| 2021 | $7,488 | $710,161 | $574,429 | $135,732 |
| 2020 | $7,446 | $702,880 | $568,539 | $134,341 |
| 2019 | $7,210 | $689,099 | $557,392 | $131,707 |
| 2018 | $7,082 | $675,588 | $546,463 | $129,125 |
| 2017 | $6,935 | $662,342 | $535,748 | $126,594 |
| 2016 | $6,626 | $649,355 | $525,243 | $124,112 |
| 2015 | $6,526 | $639,602 | $517,354 | $122,248 |
| 2014 | $6,399 | $627,074 | $507,220 | $119,854 |
Source: Public Records
Map
Nearby Homes
- 15071 Talley St
- 15232 Lille Cir
- 15202 Marne Cir
- 14942 Dahlquist Rd
- 4862 Gainsport Cir
- 5 Locust
- 14851 Jeffrey Rd Unit 199
- 14851 Jeffrey Rd Unit 350
- 14851 Jeffrey Rd Unit 248
- 14851 Jeffrey Rd Unit 61
- 14851 Jeffrey Rd Unit 334
- 14851 Jeffrey Rd Unit 352
- 14851 Jeffrey Rd Unit 25
- 14851 Jeffrey Rd Unit 145
- 14851 Jeffrey Rd Unit 246
- 15441 Alsace Cir
- 61 Ashbrook
- 22 Firebird Unit 71
- 45 Golden Glen St Unit 75
- 46 Eagle Point
- 5141 Bordeaux Ave
- 5121 Bordeaux Ave
- 5132 Skinner St
- 5122 Skinner St
- 5155 Bordeaux Ave
- 5111 Bordeaux Ave
- 5142 Skinner St
- 5112 Skinner St
- 5152 Skinner St
- 15171 Vichy Cir
- 15172 Vichy Cir
- 5171 Bordeaux Ave
- 5101 Bordeaux Ave
- 5162 Skinner St
- 5102 Skinner St
- 15181 Vichy Cir
- 5102 Bordeaux Ave
- 15182 Vichy Cir
- 15171 Lille Cir
- 5181 Bordeaux Ave