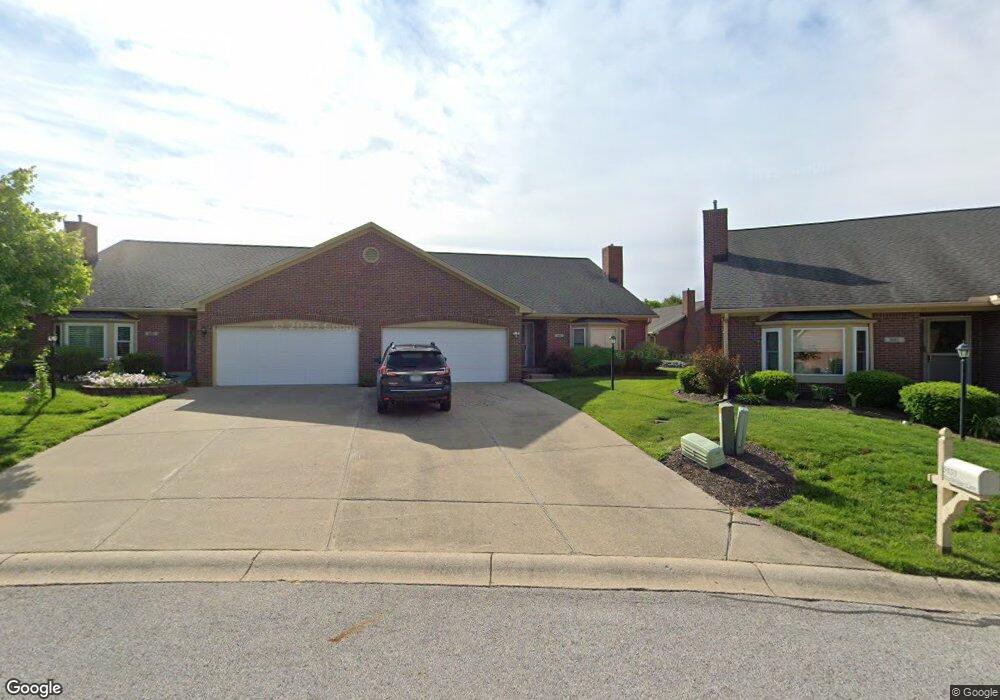
5131 Waybridge Ln Unit Block 5 Indianapolis, IN 46237
South Emerson NeighborhoodEstimated Value: $238,345 - $270,000
3
Beds
2
Baths
1,648
Sq Ft
$156/Sq Ft
Est. Value
About This Home
This home is located at 5131 Waybridge Ln Unit Block 5, Indianapolis, IN 46237 and is currently estimated at $257,336, approximately $156 per square foot. 5131 Waybridge Ln Unit Block 5 is a home located in Marion County with nearby schools including Franklin Central High School, Curtis Wilson Primary School and Academy, and Southport Presbyterian Christian School.
Ownership History
Date
Name
Owned For
Owner Type
Purchase Details
Closed on
Aug 13, 2021
Sold by
Artigue Ronald S and Artigue Gloria S
Bought by
Roush Erin M
Current Estimated Value
Home Financials for this Owner
Home Financials are based on the most recent Mortgage that was taken out on this home.
Original Mortgage
$144,000
Interest Rate
2.8%
Mortgage Type
New Conventional
Purchase Details
Closed on
Apr 20, 2012
Sold by
Gerlach Steven R
Bought by
Artigue Ronald S and Artigue Gloria S
Home Financials for this Owner
Home Financials are based on the most recent Mortgage that was taken out on this home.
Original Mortgage
$95,200
Interest Rate
3.89%
Mortgage Type
New Conventional
Purchase Details
Closed on
Jul 1, 2009
Sold by
Gerlach William A and Gerlach Patricia A
Bought by
Gerlach Patricia A
Create a Home Valuation Report for This Property
The Home Valuation Report is an in-depth analysis detailing your home's value as well as a comparison with similar homes in the area
Home Values in the Area
Average Home Value in this Area
Purchase History
| Date | Buyer | Sale Price | Title Company |
|---|---|---|---|
| Roush Erin M | -- | None Available | |
| Artigue Ronald S | -- | None Available | |
| Gerlach Patricia A | -- | None Available |
Source: Public Records
Mortgage History
| Date | Status | Borrower | Loan Amount |
|---|---|---|---|
| Previous Owner | Roush Erin M | $144,000 | |
| Previous Owner | Artigue Ronald S | $95,200 |
Source: Public Records
Tax History Compared to Growth
Tax History
| Year | Tax Paid | Tax Assessment Tax Assessment Total Assessment is a certain percentage of the fair market value that is determined by local assessors to be the total taxable value of land and additions on the property. | Land | Improvement |
|---|---|---|---|---|
| 2024 | $1,951 | $203,400 | $28,700 | $174,700 |
| 2023 | $1,951 | $184,500 | $28,700 | $155,800 |
| 2022 | $1,949 | $184,500 | $28,700 | $155,800 |
| 2021 | $1,810 | $170,800 | $28,700 | $142,100 |
| 2020 | $3,281 | $159,100 | $28,700 | $130,400 |
| 2019 | $3,211 | $155,700 | $25,300 | $130,400 |
| 2018 | $2,832 | $136,900 | $25,300 | $111,600 |
| 2017 | $2,902 | $140,500 | $25,300 | $115,200 |
| 2016 | $2,888 | $139,900 | $25,300 | $114,600 |
| 2014 | $2,138 | $106,900 | $25,300 | $81,600 |
| 2013 | $2,138 | $106,900 | $25,300 | $81,600 |
Source: Public Records
Map
Nearby Homes
- 6533 Cobham Ln
- 5122 Cobham Way
- 6519 Jade Stream Ct Unit 104
- 6519 Jade Stream Ct Unit 310
- 6526 Jade Stream Ct Unit 309
- 6510 Jade Stream Ct Unit 208
- 6414 Marble Ln
- 4925 Opal Ridge Ln Unit 309
- 6517 Emerald Hill Ct Unit 312
- 6525 Emerald Hill Ct Unit 309
- 6525 Emerald Hill Ct Unit 208
- 6516 Emerald Hill Ct Unit 310
- 5019 Amber Creek Place
- 5003 Amber Creek Place Unit 207
- 6230 Amberley Dr Unit U104
- 6239 Amber Creek Ln Unit 312
- 5202 Copper Ln
- 5431 Nathan Place
- 6522 Stockwell Dr
- 5159 E Edgewood Ave
- 5131 Waybridge Ln
- 5135 Waybridge Ln
- 5139 Waybridge Ln
- 5123 Waybridge Ln
- 6536 Waybridge Ct
- 6522 S Waybridge Ct
- 6522 Waybridge Ct
- 5143 Waybridge Ln
- 5143 Waybridge Ln Unit 4
- 6540 Waybridge Ct
- 6518 S Waybridge Ct
- 6518 Waybridge Ct
- 5124 Waybridge Ln Unit 1
- 5124 Waybridge Ln
- 6537 Cobham Ln
- 5147 Waybridge Ln
- 6539 Waybridge Ct
- 5130 Waybridge Ln
- 6535 Waybridge Ct
- 6535 Waybridge Ct Unit 3