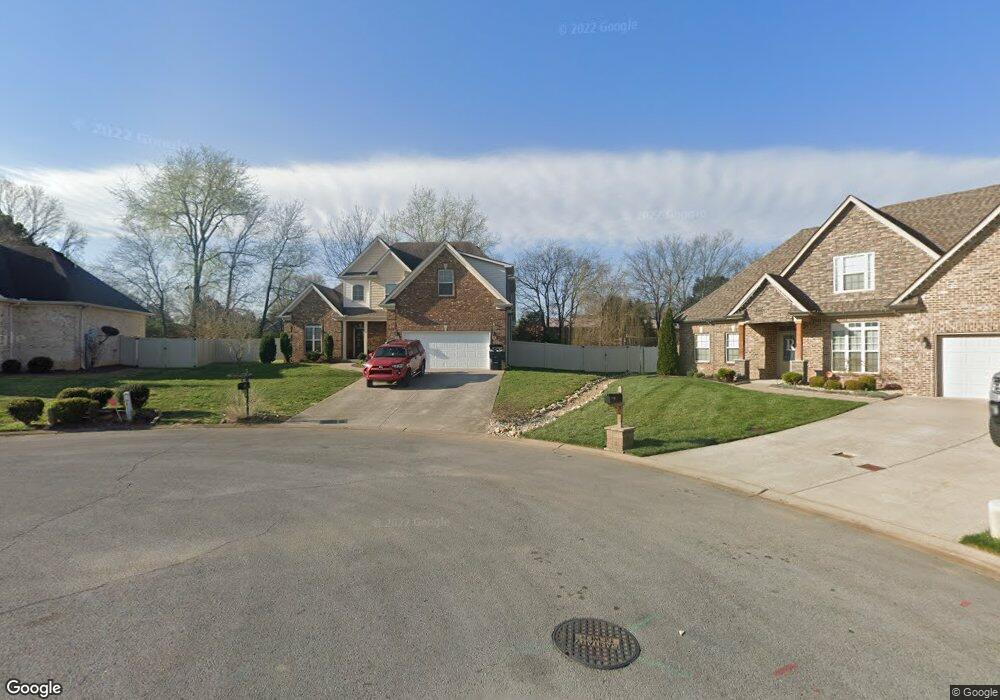
5133 Bumblebee Dr Murfreesboro, TN 37129
Estimated Value: $476,299 - $531,000
Studio
--
Bath
2,198
Sq Ft
$226/Sq Ft
Est. Value
About This Home
This home is located at 5133 Bumblebee Dr, Murfreesboro, TN 37129 and is currently estimated at $497,575, approximately $226 per square foot. 5133 Bumblebee Dr is a home located in Rutherford County with nearby schools including Brown's Chapel Elementary School, Northfield Elementary School, and Blackman Middle School.
Ownership History
Date
Name
Owned For
Owner Type
Purchase Details
Closed on
Jul 18, 2018
Sold by
Cantrell Joshua and Cantrell Katherine
Bought by
Sharp Rusell A and Sharp Krista
Current Estimated Value
Home Financials for this Owner
Home Financials are based on the most recent Mortgage that was taken out on this home.
Original Mortgage
$284,400
Outstanding Balance
$244,396
Interest Rate
4.5%
Mortgage Type
New Conventional
Estimated Equity
$253,179
Purchase Details
Closed on
Jan 10, 2014
Sold by
Waldron Gregory E
Bought by
Cantrell Joshua Katherine
Home Financials for this Owner
Home Financials are based on the most recent Mortgage that was taken out on this home.
Original Mortgage
$243,934
Interest Rate
4.44%
Mortgage Type
VA
Purchase Details
Closed on
May 2, 2013
Sold by
Waldron Roy L
Bought by
Waldron Gregory E
Home Financials for this Owner
Home Financials are based on the most recent Mortgage that was taken out on this home.
Original Mortgage
$183,040
Interest Rate
3.56%
Mortgage Type
New Conventional
Create a Home Valuation Report for This Property
The Home Valuation Report is an in-depth analysis detailing your home's value as well as a comparison with similar homes in the area
Home Values in the Area
Average Home Value in this Area
Purchase History
| Date | Buyer | Sale Price | Title Company |
|---|---|---|---|
| Sharp Rusell A | $316,000 | Biltmore Title Llc | |
| Cantrell Joshua Katherine | $238,800 | -- | |
| Waldron Gregory E | $43,500 | -- |
Source: Public Records
Mortgage History
| Date | Status | Borrower | Loan Amount |
|---|---|---|---|
| Open | Sharp Rusell A | $284,400 | |
| Previous Owner | Cantrell Joshua Katherine | $243,934 | |
| Previous Owner | Waldron Gregory E | $183,040 |
Source: Public Records
Tax History
| Year | Tax Paid | Tax Assessment Tax Assessment Total Assessment is a certain percentage of the fair market value that is determined by local assessors to be the total taxable value of land and additions on the property. | Land | Improvement |
|---|---|---|---|---|
| 2025 | $2,854 | $100,875 | $16,250 | $84,625 |
| 2024 | $2,854 | $100,875 | $16,250 | $84,625 |
| 2023 | $1,893 | $100,875 | $16,250 | $84,625 |
| 2022 | $1,630 | $100,875 | $16,250 | $84,625 |
| 2021 | $1,534 | $69,125 | $11,875 | $57,250 |
| 2020 | $1,534 | $69,125 | $11,875 | $57,250 |
| 2019 | $1,534 | $69,125 | $11,875 | $57,250 |
| 2018 | $2,107 | $69,125 | $0 | $0 |
| 2017 | $2,199 | $56,575 | $0 | $0 |
| 2016 | $2,199 | $56,575 | $0 | $0 |
| 2015 | $2,199 | $56,575 | $0 | $0 |
| 2014 | $1,407 | $56,575 | $0 | $0 |
| 2013 | -- | $8,900 | $0 | $0 |
Source: Public Records
Map
Nearby Homes
- 5140 Cicada Cir
- 5142 Stonesbattle Pkwy
- 2912 Butterfly Bend
- 5226 Ladybug Ln
- 3033 Asbury Rd
- 3050 Asbury Rd
- 5342 Keystone Ct
- 346 Heatherwood Dr
- 5035 Little Adams Run
- 228 Heatherwood Dr
- 507 Heatherwood Dr
- 4844 Nina Marie Ave
- 4917 Laura Jeanne Blvd Unit 52
- 4712 Chelanie Cir
- 4906 Laura Jeanne Blvd
- 4739 Chelanie Cir
- 4815 Octavia St
- 3434 Florence Rd
- 5310 Pointer Place
- 3340 Fletz Cir
- 5137 Bumblebee Dr
- 5129 Bumblebee Dr
- 5141 Cicada Cir
- 5137 Cicada Cir
- 5125 Bumblebee Dr
- 5138 Bumblebee Dr
- 5136 Cicada Cir
- 5134 Bumblebee Dr
- 5130 Bumblebee Dr
- 5121 Bumblebee Dr
- 5149 Cicada Cir
- 5144 Cicada Cir
- 5153 Cicada Cir
- 5139 Honeybee Dr
- 5135 Honeybee Dr
- 5117 Bumblebee Dr
- 2807 Florence Rd
- 5124 Bumblebee Dr
- 5143 Honeybee Dr
Your Personal Tour Guide
Ask me questions while you tour the home.